
More Information
Submitted: December 20, 2023 | Approved: December 27, 2023 | Published: December 28, 2023
How to cite this article: Bah K, Bah AN, Jallow AW. Modeling the Risk of Liver Cancer in Adults: A Machine Learning Investigation into the Role of Obesity and Overweight. Arch Pathol Clin Res. 2023; 7: 034-045.
DOI: 10.29328/journal.apcr.1001039
Copyright License: © 2023 Bah K, et al. This is an open access article distributed under the Creative Commons Attribution License, which permits unrestricted use, distribution, and reproduction in any medium, provided the original work is properly cited.
Keywords: Liver cancer; Obesity; Overweight; Machine learning; Risk prediction
Abbreviations: AUC: Area Under the Curve; RF: Random Forest; ROC: Receiver Operating Characteristic; AUPR: Area Under Precision-Recall; LR: Logistic Regression; XGBoost: Extreme Gradient Boosting; BMI: Body Mass Index; WHO: World Health Organization; SMOTE: Synthetic Minority Over-Sampling Technique; CV: Cross-Validation; AIC: Akaike Information Criteria; OR: Odds Ratio; SVM: Support Vector Machine; HBV: Hepatitis B Virus; HCV: Hepatitis C Virus; CI: Confident Interval; EMR: Electronic Medical Record; MIMIC: III Medical Information Mart for Intensive Care

Modeling the Risk of Liver Cancer in Adults: A Machine Learning Investigation into the Role of Obesity and Overweight
Karamo Bah1*, Adama Ns Bah1 and Amadou Wurry Jallow2
1“1Graduate Institute of Biomedical Informatics, College of Medical Science and Technology, Taipei Medical University, Taipei 11031, Taiwan
2Department of Medical Laboratory Science and Biotechnology, Taipei Medical University, Taipei 11031, Taiwan
*Address for Correspondence: Karamo Bah, Graduate Institute of Biomedical Informatics, College of Medical Science and Technology, Taipei Medical University, Taiwan, Email: [email protected]
Background: Liver cancer is a global health concern, with overweight and obese individuals exhibiting an increased risk of its development. Understanding the interplay between obesity-related factors and liver cancer incidence is crucial for early prediction and intervention.
Aim: The aim of this investigation was to construct and validate an extreme gradient boosting (XGBoost) based machine learning model for the purpose of establishing a one-year liver cancer risk prediction system specifically tailored to overweight and obese patients. In addition, this study sought to compare the predictive performance of the XGBoost model with those of a random forest model and a logistic regression model, while also identifying the most influential predictive features for liver cancer incidence.
Methods: A comprehensive retrospective analysis was conducted on MIMIC III data comprising 2,354 patients. To predict the risk of liver cancer development, three machine learning models were developed: XGBoost, random forest, and logistic regression. Feature selection was executed using a stepwise regression procedure encompassing both forward selection and backward elimination.
Results: The stepwise regression technique unveiled 14 predictive factors for liver cancer incidence. Among the patient cohort, 132 individuals developed liver cancer within a year of follow-up, while 2,222 did not. Notably, most liver cancer cases occurred in male patients (60%). Statistically significant differences were observed between patients with liver cancer and those without, in terms of age, gender, total bilirubin, platelet, albumin, chloride, potassium, sodium, prothrombin time (PT) and alanine aminotransferase (ALT). The XGBoost model exhibited an impressive area under the receiver operating characteristic curve (AUROC) of 99%, Random Forest (RF) of 99%, and Logistic Regression (LR) of 90%. In a multivariate analysis, total bilirubin, creatinine levels, age, gender, ALT, alkaline phosphate (ALP), PT, calcium, and chloride emerged as independent predictors for liver cancer incidence.
Conclusion: The XGBoost model demonstrated superior predictive performance when compared to the RF and LR models. If corroborated through prospective studies, the XGBoost model may prove to be a valuable tool for the early prediction of liver cancer risk in overweight or obese individuals. Such predictive capabilities could, in turn, facilitate the implementation of timely preventive interventions against liver cancer.
In recent years, the world has witnessed a concerning surge in cancer-related mortality, with cancer accounting for a substantial portion of global deaths. The leading contributors to this worldwide trend are liver cancer, colorectal cancer, and breast cancer, collectively responsible for a significant proportion of cancer-related fatalities. These trends reflect a broader global phenomenon, with the age-adjusted incidence and mortality rates of cancer in developed countries showing a steady upward trajectory since the mid-1980s [1].
Liver cancer has gained notoriety, as its incidence rate has exhibited a relentless climb in various parts of the world [2]. Globally, liver cancer ranks as the sixth most frequently diagnosed cancer and the third leading cause of cancer-related death, accounting for approximately 500,000 new cases each year [1]. The prognosis for liver cancer remains grim, with a 5-year survival rate ranging between a mere 6% to 11%. A significant proportion of liver cancer cases can be attributed to infections with hepatitis C virus (HCV) and hepatitis B virus (HBV) [3], with other common risk factors including excessive alcohol consumption, tobacco use, and exposure to aflatoxin B1. The escalating incidence and mortality rates of liver cancer in developed countries have correspondingly given rise to a burgeoning epidemic of overweight and obesity, which is a global public health challenge [4]. These conditions have afflicted a substantial portion of the world’s population, with approximately 1.9 billion adults grappling with these issues. The underlying causes are multifaceted, encompassing factors such as sedentary lifestyles and insufficient physical activity. Notably, more than 600 million adults are categorized as overweight or obese among this demographic. The World Health Organization (WHO) has reported a grim statistic obesity contributes to roughly 3.4 million deaths annually, involving not only liver cancer but also other non-communicable diseases, including cardiovascular disorders and various forms of cancer [5]. While some observational studies have suggested a connection between excess body weight and an elevated risk of various cancers, the evidence pertaining to liver cancer has remained inconclusive and scarce [6]. Nevertheless, some research has identified obesity as an independent risk factor for a spectrum of cancers, including breast cancer, colon cancer, renal cell carcinoma, and liver cancer. Meta-analyses exploring the link between obesity or overweight and the onset of liver cancer have revealed a 17% to 89% increased risk compared to those with normal weight [7,8]. In a comprehensive analysis of prospective studies, a 5kg/ m2 increase in body mass index (BMI) was associated with a 25% increased risk of liver cancer [8,9]. A systematic review comprising 10 different cohort studies substantiated a positive correlation between obesity and liver cancer [10].
Against this backdrop, this study endeavors to introduce and validate a machine-learning algorithm known as extreme gradient boosting (XGBoost), with the aim of constructing a predictive model for liver cancer risk over a one-year period. This model is tailored specifically to the overweight and obese population, drawing from data in the MIMIC-III database. The study seeks to benchmark the performance of XGBoost against well-established algorithms, including Random Forest (RF) and Logistic Regression model (LR). Additionally, we aim to elucidate the most critical features underpinning the prediction model, shedding light on the complex relationship between obesity and liver cancer risk on a global scale.
Data source and study population
For our study, we harnessed the extensive Medical Information Mart for Intensive Care (MIMIC III) Version 1.4 database. MIMIC III serves as an openly accessible repository, hosting de-identified records of 46,520 patients and encompassing a total of 58,976 admissions at the Beth Israel Deaconess Medical Center in Boston, USA. The data range from June 1, 2001, to October 31, 2012. This invaluable resource contains a wealth of information, including demographic profiles, admission notes, International Classification of Diseases-9th revision (ICD-9) diagnoses, laboratory test results, medication histories, procedural details, fluid balance records, discharge summaries, vital sign measurements taken at the bedside, caregiver’s notes, radiology reports, and survival outcomes [11].
Selection of cases and controls
In the process of our study, we meticulously identified two distinct groups: cases and controls. The cases consisted of individuals who developed liver cancer within a 1-year follow-up period after being diagnosed as overweight or obese. To ensure the robustness of our case selection, we required that these individuals had a minimum of two subsequent hospital visits following their diagnosis of overweight or obesity. To address the temporal variability in patient visits, we strategically selected the second (2nd) visit, denoted as the index date, for each patient. This selection was made since patients’ initial visit could fall at varying times. Consequently, our case group comprised 132 individuals, all of whom were diagnosed with liver cancer within one year of the sampled visit, Figure 1.
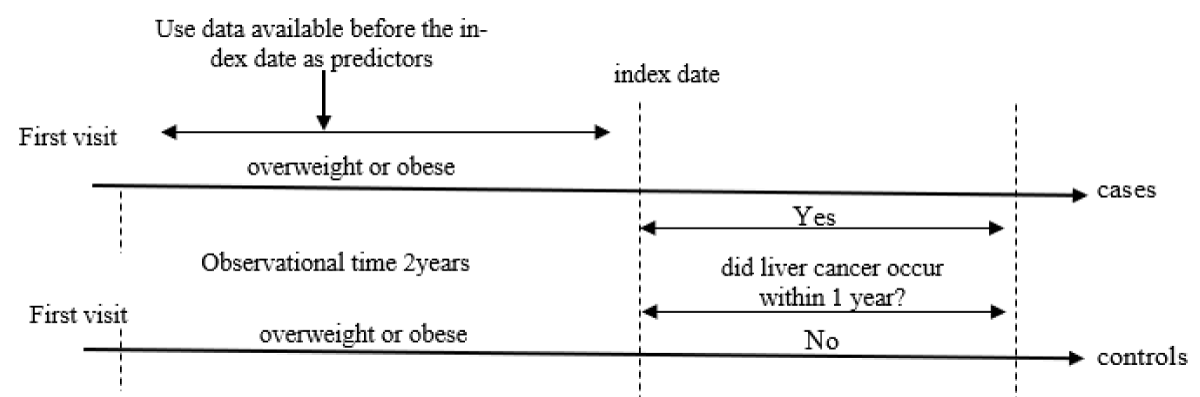
Figure 1: Timeline of study period schema.
Conversely, the control group included 2,222 individuals who did not have liver cancer during the 1-year follow-up period. The rationale behind creating these two distinct groups was to facilitate the assessment of a clinically relevant measure. Specifically, we aimed to provide physicians with the ability to estimate the likelihood of an overweight or obese patient developing liver cancer within one year from the time of their clinic visit. This estimation was based on the comprehensive array of features available at the time of the hospital visit, ensuring a thorough evaluation of the predictive factors associated with liver cancer in this population.
Handling missing values in clinical data
In our analysis, it is imperative to address the issue of missing values within the clinical dataset, a common challenge encountered in such datasets. Missing values, as the term implies, refer to situations where specific data attributes are absent or unrecorded for certain observations [12]. To mitigate the impact of missing values on the integrity of our analysis, we employed an imputation method [13] in R programming software. Imputation is a statistical technique that allows us to estimate and fill in missing values, enabling a more comprehensive and reliable analysis of the dataset.
Imputation serves as a crucial step in data preprocessing, ensuring that the statistical models we utilize have complete and informative data to work with. By imputing missing values, we reduce the potential bias and improve the overall robustness of our findings. This process involves replacing missing values with estimated values based on the available information and the characteristics of the dataset.
Feature extraction and selection
In this study, we employed a meticulous approach to the extraction and selection of predictive features for our liver cancer risk prediction model. The selection process was informed by a comprehensive literature review and enriched through discussions with a senior physician who possesses specialized expertise in clinical care research related to obesity and liver cancer. Our selection of predictive features encompassed a wide array of data sources, including laboratory results, demographic information, and various clinical parameters. This holistic approach aimed to ensure that our model would consider a comprehensive set of factors potentially associated with liver cancer risk.
For the feature selection process, we employed a stepwise logistic regression model [14], a statistical technique known for its ability to automatically determine the most relevant predictors for the model. Within the stepwise regression framework, we further applied both forward selection and backward elimination techniques. These methods collectively allow for the identification of the most informative features for our liver cancer risk prediction model, ensuring that we consider a balanced perspective in selecting features.
To gauge the suitability of features for inclusion in our model, we used the Akaike information criterion (AIC) [15] as a feature selection criterion. The AIC is a widely accepted statistical measure that balances the trade-off between model complexity and goodness of fit. By utilizing the AIC, we ensured that the selected features would contribute significantly to the predictive accuracy of our model while avoiding unnecessary complexity. This rigorous feature extraction and selection process not only enhances the robustness of our liver cancer risk prediction model but also ensures that our approach aligns with established statistical methodologies and clinical expertise in the field.
Model Development and Feature Selection:
In the course of this study, we embarked on the development and subsequent validation of a machine learning model known as XGBoost [16], with the primary goal of creating a robust one-year prediction model for liver cancer risk. This predictive model was meticulously tailored to the unique population of overweight and obese patients. Furthermore, our investigation entailed a comparative evaluation of the predictive performance of XGBoost against two other established models, Random Forest (RF) [17, 18] and Logistic Regression (LR) [19] Figure 2.
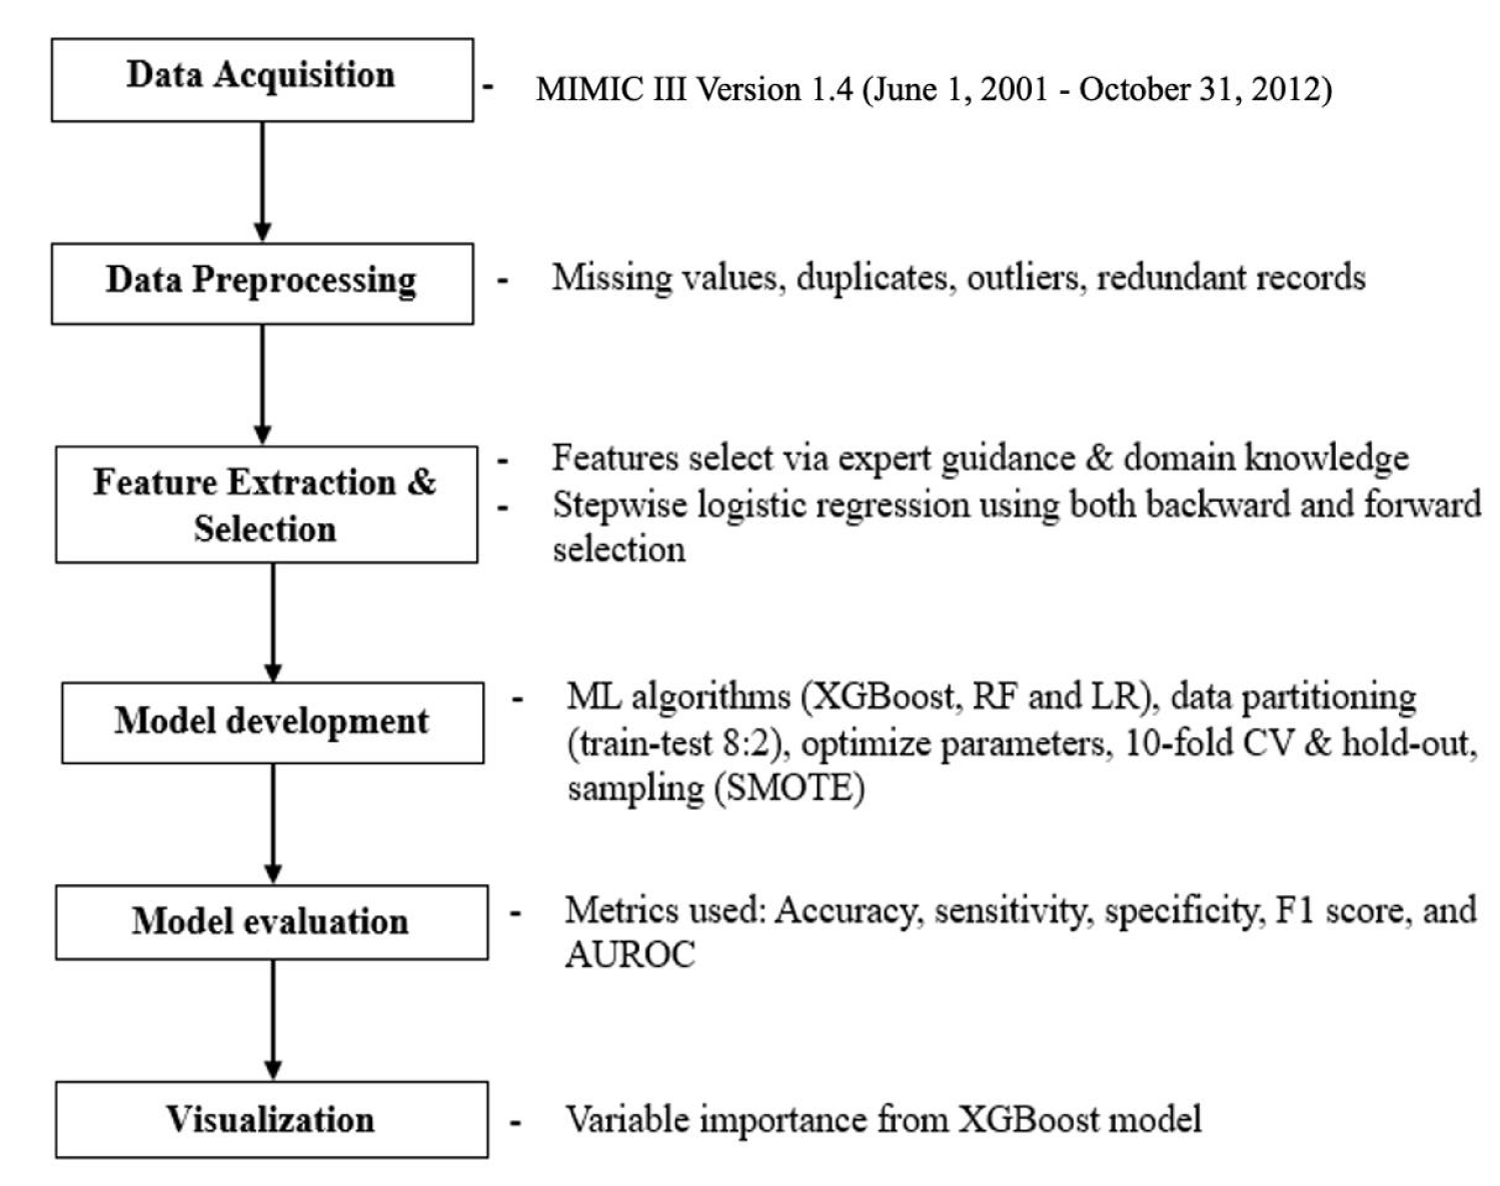
Figure 2: Overview of predictive model development.
The process of model development was underpinned by a thoughtful selection of relevant features that would contribute to the predictive accuracy and clinical utility of our models. These features, serve as the foundational elements of our predictive models.
Our commitment to feature selection was not only aimed at optimizing model performance but also at elucidating the critical factors contributing to the risk of liver cancer among overweight and obese individuals. In doing so, we intended to provide a deeper understanding of the key determinants of liver cancer incidence within this specific cohort. This comprehensive approach to feature selection and model development reflects our dedication to not only building predictive tools but also advancing the knowledge base surrounding liver cancer risk in this high-risk patient demographic.
Extreme gradient boosting (XGBoost)
The Extreme Gradient Boosting (XGBoost) model, initially introduced by reference [16], represents a notable advancement in the realm of machine learning. XGBoost has demonstrated remarkable capabilities in improving performance and enhancing the speed of gradient-boosted decision trees. This algorithm employs a unique training process that leverages diverse datasets to amalgamate weak predictors into potent predictive models. A distinctive feature of XGBoost is its sequential modeling approach, where each decision tree depends on the outcomes of the preceding one, resulting in the construction of a highly robust predictor [20]. The final model, as computed by the XGBoost algorithm, comprises an ensemble of several decision trees. XGBoost consistently demonstrates its ability to outperform single decision tree models. However, the degree to which XGBoost surpasses other machine learning models, such as Support Vector Machines (SVM) [21] and Gradient Boosting Decision Trees [22]. has been empirically substantiated [23].
Random Forest (RF)
Random Forest [18], a widely employed machine learning algorithm, serves as a versatile tool for classification and regression tasks. Recognized for its ability to model intricate interactions among exploratory variables, this algorithm forms an ensemble of tree-like models [18,24]. One of its key strengths lies in its capacity to swiftly and effectively handle noisy data, making it particularly valuable in real-world applications. Random Forest excels in uncovering non-linear relationships within datasets and exhibits robustness in accommodating both continuous and discrete data types [25]. Moreover, it provides valuable insights into the presence of outliers within the data and identifies the most influential features in the predictive model.
Logistic Regression (LR)
Logistic Regression (LR) analysis, while tracing its origins back to the early nineteenth century, has experienced a resurgence in healthcare research over the past two decades [26]. It has emerged as a pivotal statistical tool, especially when the objective is to predict a binary (dichotomous) outcome based on one or more independent variables. LR finds prominent application in scenarios where the primary aim is to predict binary outcome classes, such as determining the presence or absence of a specific medical condition or ascertaining the validity of a particular proposition (true or false). Its resurgence in healthcare research [27] signifies its enduring relevance and adaptability in addressing contemporary research questions and healthcare challenges.
Addressing sampling and class imbalance
In the realm of machine learning model evaluation, accuracy is a widely used metric for assessing predictive performance. However, its utility diminishes when dealing with imbalanced datasets, as is the case in our study. Here, we encounter a substantial variance between patients who have been diagnosed with liver cancer and those who have not, particularly among the population of obese and overweight individuals. In this context, our prediction task necessitates a high rate of accurate identification of liver cancer cases within this specific demographic.
Class imbalance issues are typically managed through one of several strategies, such as oversampling the minority class, undersampling the majority class [28], or employing a hybrid approach that combines both techniques [29]. It is worth noting that each of these strategies carries its own set of challenges. Undersampling, for instance, may lead to the removal of critical patterns, resulting in the loss of vital information. Conversely, oversampling may inadvertently introduce overfitting and increase computational demands.
To mitigate these challenges, our study leverages the Synthetic Minority Over-sampling Technique (SMOTE) [30], which was originally introduced by Chawla and his colleagues. The SMOTE method stands out as an innovative approach, as it creates synthetic examples instead of merely replicating existing ones. This technique effectively counteracts the issues associated with traditional oversampling, preventing overfitting, and preserving the integrity of the dataset by generating new, synthetic instances that closely resemble the minority class. By implementing SMOTE, we aim to enhance the predictive performance of our model in the face of class imbalance, ultimately improving the accuracy of liver cancer detection among obese and overweight patients.
Model evaluation and validation
In this section, we elaborate on the methodologies employed for evaluating and validating our prediction models, highlighting key performance metrics that aid in assessing their effectiveness. Our evaluation process incorporated both the hold-out method [31] and the 10-fold cross-validation method to ensure robust and reliable results.
Hold-out method
Initially, the dataset was bifurcated into two distinct subsets: a training set and a test set. The training set played a pivotal role in facilitating the classifier’s training process, allowing the model to learn from the data. Subsequently, the test set was utilized to gauge the prediction error rate after the model’s training was complete. Notably, the training set also played an essential role in generating prediction models, which were subjected to a subsequent 10-fold cross-validation [32] step to further enhance model robustness.
10-fold cross-validation
To reinforce the credibility of our model’s performance, a 10-fold cross-validation approach was implemented. This technique divided the dataset into ten equal partitions, iteratively employing nine of these partitions for training and the remaining one for testing. This process was repeated ten times, ensuring that each partition served as a test set at least once. The results from these iterations were then aggregated, providing a comprehensive evaluation of model performance.
Evaluation metrics
To comprehensively assess the performance of our model, the following metrics were employed:
i. AUROC (Area Under Receiver Operating Characteristics)
The AUROC is a crucial metric that quantifies the model’s ability to discriminate between cases and control instances. It provides a comprehensive overview of the model’s predictive power.
ii. Accuracy
Accuracy measures the overall correctness of the model’s predictions and is computed as the ratio of true positives (TP) and true negatives (TN) to the total instances under consideration.
iii. Sensitivity/Recall
Sensitivity, often referred to as recall, assesses the model’s ability to correctly identify positive instances. It is calculated as the ratio of true positives (TP) to the sum of true positives and false negatives (FN).
iv. Specificity
Specificity evaluates the model’s aptitude for correctly recognizing negative instances. It is determined by the ratio of true negatives (TN) to the sum of true negatives and false positives (FP).
v. F-score
The F-score, which considers both precision and recall, offers a balanced assessment of the model’s performance. It is calculated as the harmonic mean of precision and recall and is expressed as (2 × Precision × Recall) / (Precision + Recall).
Where:
- TP: True Positives
- TN: True Negatives
- FN: False Negatives
- FP: False Positives
Statistical analysis
In this section, we describe the statistical analysis employed to scrutinize the demographic and clinical characteristics of patients within the liver cancer and non-liver cancer groups. The aim was to discern meaningful distinctions between these two cohorts. The student t-test was utilized for comparing continuous variables, which included demographic and clinical attributes. Additionally, the Chi-square test or Fisher’s exact test was applied to gauge disparities between categorical variables. The chosen threshold for statistical significance throughout the analyses was set at p < 0.05. This level was deemed crucial in determining the statistical validity of observed differences between groups.
Data preprocessing and software utilized
All data preprocessing tasks, including data cleaning were executed using R software, specifically R version 4.3.0 (2023-04-21). R is renowned for its capabilities in data manipulation and statistical analysis.
For the development of the machine learning models employed in this study, Python version 3.9 was the chosen programming language, implemented within the Jupyter Notebook environment. Python’s versatility and rich ecosystem of machine learning libraries made it an ideal choice for building, training, and evaluating the predictive models that played a pivotal role in this research. The adoption of these modern analytical tools allowed for a comprehensive and robust exploration of the relationships and predictive factors associated with liver cancer in the context of obesity and overweight.
Baseline characteristics
The study included a cohort of 2,345 patients with overweight or obese. Within this population, 132 developed liver cancer. Among these, 79 (60%) were male, while 53 (40%) were female. The median age of these liver cancer patients was 58 years, with the age range spanning from 33 to 84 years.
For the 2,222 individuals who were not diagnosed with liver cancer during the study, a breakdown of the data revealed that 1,089 (49%) were male, and 1133 (51%) were female. The median age within this group was 60 years, with an age range extending from 16 to 88 years, Table 1.
| Table 1: Baseline characteristics. | |||
| Variables | Liver cancer (n = 132) |
non-Liver cancer (n = 2,222) |
p value |
| Demographics | |||
| Age (yrs.), median (min-max) | 58 (33 – 84) | 60 (16 – 88) | 0.010* |
| Gender (Male) n (%) | 79 (60) | 1,089 (49) | 0.056* |
| Cardiac Enzymes | |||
| Platelet count (K/uL) | 122 (84.9 – 190.7) | 234 (181.2 – 299.2) | < 0.00* |
| Liver function markers | |||
| Albumin (g/dL) | 3 (2.69 – 3.35) | 3.2 (3.1 – 3.4) | < 0.00* |
| TBIL (mg/dL) | 1.95 (0.91 – 3.97) | 0.55 (0.43 – 0.60) | < 0.00* |
| Creatinine (mg/dL) | 1.21 (0.86 – 2.02) | 0.96 (0.74 – 1.36) | 0.439 |
| ALP (IU/L) | 95.2 (73.7 – 149.7) | 80 (70 – 89.3) | 0.685 |
| ALT (IU/L) | 28.29 (20.6 – 56.4) | 26.0 (21.0 – 32.0) | 0.041* |
| AST (IU/L) | 52.1 (32.7 – 107) | 31.4 (25.0 36.3) | 0.182 |
| PT (s) | 16 (15 – 20.5) | 14 (13.1 – 15.5) | 0.001* |
| Electrolyte levels | |||
| Potassium (mEq/L) | 4.0 (3.76 – 4.31) | 4.12 (3.9 – 4.36) | 0.001* |
| Calcium (mg/dL) | 8.44 (8.07 – 8.87) | 8.53 (8.2 – 8.86) | 0.186 |
| Chloride (mEq/L) | 103 (103.3 – 106.5) | 103 (100.6 – 105.5) | 0.010* |
| Sodium (mEq/L) | 137 (135.5 – 140.1) | 138 (137 – 140.6) | <0.00* |
| TBIL: Total Bilirubin; AST: Aspartate Aminotransferase; ALP: Alkaline Phosphate; PT: Prothrombin Time; ALT: Alanine Aminotransferase; mg/dl: Milligrams Per Deciliter; IU/L: International Units Per Liter; yrs: Years; K/uL: Thousand Per Microliter; %: Percentage; mEq/L: Milliequivalents Per Liter. Continuous values were recorded as median (1–3rd quantile), and categorical values (absolute numbers and percentages). The Chi-square test was used for the comparison of categorical variables and the two-sample t-test for continuous variables. All p values were two-sided. Statistical significance was defined as p < 0.05. | |||
Hyperparameters tuning and model configuration
Hyperparameters are crucial components in machine learning [33], representing parameters that can be manually set or configured before initiating the model training process. These hyperparameters retain their predetermined values or settings throughout the training process. In our study, we conducted hyperparameter tuning for each of the machine learning algorithms while retaining default values for the remaining parameters.
For the XGBoost model, we adjusted the following hyperparameters: learning rate set to 0.3, the learning rate controls the step size during gradient descent, influencing the convergence speed and model performance. max depth limited to 5, the max depth constrains the depth of the decision trees within the ensemble, thus preventing overfitting. For alpha, we assigned a value of 10, alpha determines the L1 regularization term strength, influencing the model’s ability to handle multicollinearity. n Estimators fixed at 100, this parameter dictates the number of trees in the XGBoost ensemble, impacting model robustness.
In the case of the logistic regression model, we utilized a penalty parameter of 12, which regulates the type of regularization applied. Higher penalty values emphasize stronger regularization. C (Inverse of Regularization Strength set to 100.0, the C parameter controls the inverse of regularization strength, with higher values reducing the impact of regularization. Tolerance (Tol) is established at 0.000001, and the tolerance value influences the convergence criterion, specifying the required change in the cost function. Maximum Iterations (Max Iter) are limited to 1000, this parameter governs the maximum number of iterations performed during optimization.
For the random forest model, mtry (Number of Features to Consider for the Best Split) is specified as 4, and mtry determines the number of features considered when searching for the best split at each node. n estimators set at 100, this parameter controls the number of decision trees in the random forest ensemble, affecting model stability. min sample split fixed at 20, the min sample split designates the minimum number of samples required to split an internal node. min samples leaf established as 2, the min samples leaf determines the minimum number of samples necessary for a node to be considered a leaf. The Random State assigned a value of 41, the random state ensures the reproducibility of results when randomness is involved in the algorithm.
Machine learning models performance
To gauge the performance of our machine learning model, we utilized a variety of model evaluation metrics. A comparative analysis between the XGBoost model and two other models, namely Random Forest (RF) and Logistic Regression (LR), is presented in Table 2.
| Table 2: Model performance. | |||||
| Models | Accuracy (%) | Sensitivity (%) | Specificity (%) | AUROC (%) | F1 Score (%) |
| XGBoost | 0.96 | 0.94 | 0.97 | 0.99 | 0.96 |
| RF | 0.95 | 0.95 | 0.96 | 0.99 | 0.94 |
| LR | 0.81 | 0.87 | 0.77 | 0.90 | 0.82 |
| XGBoost: Extreme Gradient Boosting; RF: Random Forest; LR: Logistic Regression; AUROC: Area Under The Receiver Operating Characteristic | |||||
The XGBoost model demonstrated a robust performance with an accuracy of 96%, showcasing its reliability on unseen data. Notably, the model achieved a sensitivity of 94%, effectively identifying individuals at risk of liver cancer. Furthermore, the model exhibited a high specificity rate of 97%. The impressive AUC score of 99% highlights its excellent ability to discriminate between positive and negative cases. Additionally, the model achieved a commendable F1 score of 96%, reflecting a well-balanced predictive performance that combines precision and recall.
The RF model demonstrated an accuracy of 95%, a sensitivity rate of 95%, and a specificity rate of 96%. The model F1 score of 95%, illustrates a well-balanced performance in terms of precision and recall.
The LR model achieved an accuracy of 81%, and a sensitivity of 87%, implying its capability to correctly identify a portion of individuals at risk. With a specificity rate of 77%, the LR model correctly classifies some individuals who are not at risk of liver cancer. The F1 score was 82%.
Receiver Operating Characteristic (ROC) curves for the Models
The Receiver Operating Characteristic (ROC) curve analysis provides crucial insights into the performance of our models in distinguishing between liver cancer and non-liver cancer cases. The AUROC is a vital metric that quantifies this discrimination capability Figure 3.
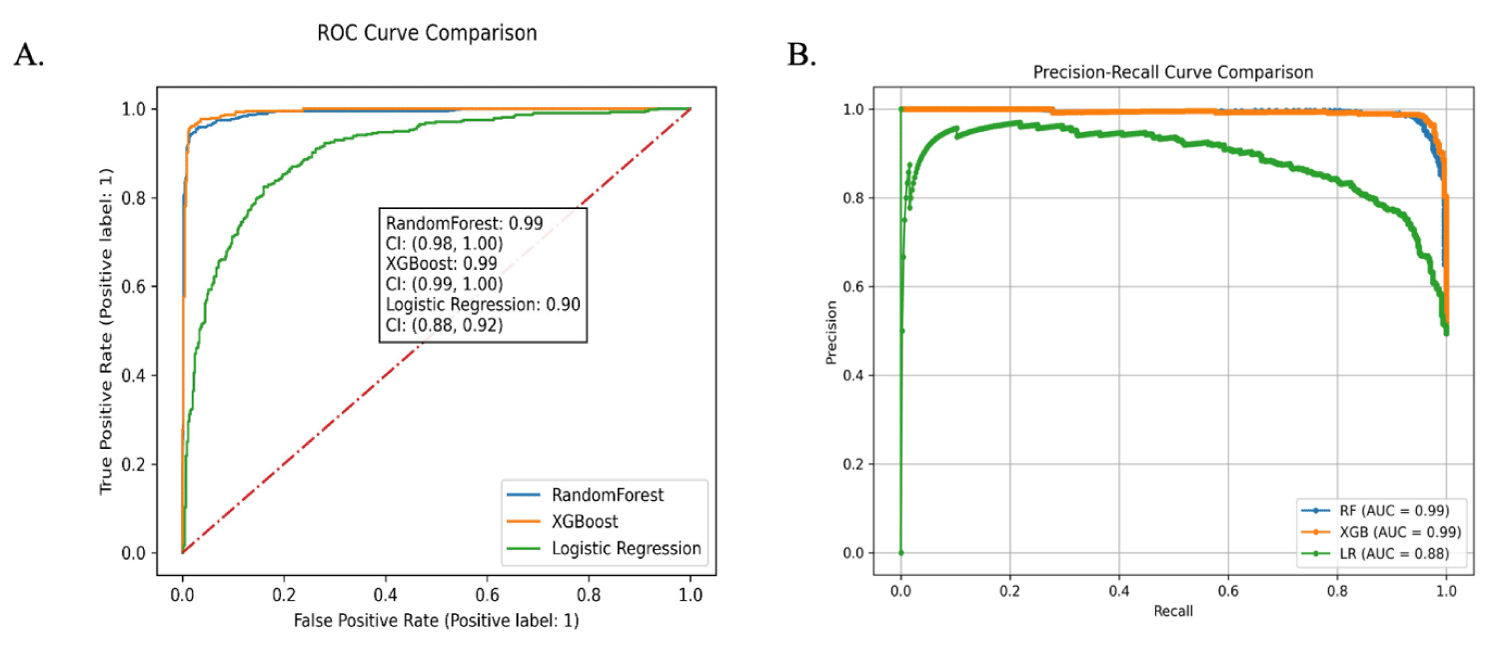
Figure 3: Receiver operator characteristic curves and precision-recall curve. (A) Receiver operating characteristic curve. (B) Precision-recall curve.
For our study, the results of the ROC analysis demon-strated the following AUROC values for the different models: the XGBoost model exhibited an exceptional AUROC of 99%, the Random Forest model achieved a commendable AUROC of 99%, and the Logistic Regression model yielded an AUROC of 90%. These AUROC values are indicative of the models’ proficiency in distinguishing between liver cancer and non-liver cancer cases.
Evaluation of feature importance
Understanding the relevance and significance of individual features is crucial to gauge their impact on the predictive performance of our models. We employed variable importance plots to elucidate the order of importance of these features in our analysis.
For our XGBoost model, Figure 4, we determined feature importance using the “f-score.” The f-score represents the number of times a specific feature is employed to partition the data across all decision trees within the model. A higher f-score indicates that a particular feature plays a more prominent role in the model’s predictive accuracy, making it a valuable predictor of liver cancer risk.
Figure 3: Feature importance contributed to the XGBoost model. TBil: Total Bilirubin; AST: Aspartate Aminotransferase; ALP: Alkaline Phosphate; PT: Prothrombin Time; ALT: Alanine Aminotransferase
Multivariate analysis revealing factors influencing liver cancer risk
A comprehensive multivariate analysis, conducted through logistic regression, brought to light the substantial impact of various factors on the risk of liver cancer (as summarized in Table 3). The results shed light on the associations between key parameters and the likelihood of developing liver cancer, highlighting the influence of these variables when altered by one unit.
| Table 3: Multivariate analysis of factors for Liver Cancer. | |||
| Features | Adjusted Odd Ratio | 95% confidence interval | p - value |
| Age | 1.01 | 0.96 – 1.03 | 0.011* |
| Gender | 1.41 | 0.93 – 1.56 | 0.037* |
| Platelet count (K/uL) | 0.99 | 0.99 – 0.99 | < 0.00* |
| Albumin (g/dL) | 0.41 | 0.26 – 0.65 | < 0.00* |
| TBIL (mg/dL) | 1.18 | 1.10 – 1.27 | < 0.00* |
| Creatinine (mg/dL) | 1.07 | 0.90 – 1.27 | 0.451 |
| ALP (IU/L) | 1.04 | 0.99 – 1.08 | 0.692 |
| ALT (IU/L) | 1.01 | 0.99 – 1.02 | 0.041* |
| AST (IU/L) | 0.99 | 0.99 – 1.00 | 0.066 |
| PT (s) | 1.06 | 1.02 – 1.10 | 0.004* |
| Potassium (mEq/L) | 0.47 | 0.26 – 0.83 | 0.008* |
| Calcium (mg/dL) | 1.28 | 0.89 – 1.84 | 0.212 |
| Chloride (mEq/L) | 1.08 | 1.01 – 1.15 | 0.027* |
| Sodium (mEq/L) | 0.86 | 0.79 – 0.93 | < 0.00* |
| TBIL: Total Bilirubin; AST: Aspartate Aminotransferase; ALP: Alkaline Phosphate; PT: Prothrombin Time; ALT: Alanine Aminotransferase; mg/dl: Milligrams Per Deciliter; IU/L: International Units Per Liter; K/uL: Thousand Per Microliter; mEq/L: Milliequivalents Per Liter | |||
These findings offer valuable insights into the complex interplay of factors that contribute to liver cancer risk, aiding in the development of more precise risk assessment models and targeted preventive strategies.
The development and validation of a one-year liver cancer risk prediction system targeted at overweight and obese patients represent a significant advancement in personalized healthcare. The implementation of an extreme gradient boosting (XGBoost) machine learning model demonstrated promising predictive performance, showcasing its potential as an effective tool for risk assessment in this specific population.
Our study aimed to not only construct a robust prediction model but also to compare its performance against established methods such as random forest and logistic regression. The XGBoost model exhibited superior predictive accuracy, highlighting its suitability for discerning nuanced patterns in the data, especially in the context of liver cancer risk among overweight and obese individuals. Such success can be attributed to the ensemble nature of XGBoost, enabling it to capture intricate associations in the data without necessitating the specification of high-order interactions or non-linear functions [20]. This finding aligns with the growing recognition of the effectiveness of XGBoost in handling complex relationships within medical datasets [34,35].
A multivariate analysis pinpointed several independent predictors closely associated with liver cancer. Notably, total bilirubin, creatinine levels, age, gender, ALT, alkaline phosphate (ALP), prothrombin time (PT), calcium, and chloride were strongly linked to liver cancer incidence, while platelet, albumin, AST, potassium, and sodium appeared as protective factors.
The marginal increase in liver cancer risk with age suggests that, in our study population of overweight and obese individuals, age plays a relatively subtle role. In a cohort of individuals diagnosed with liver cancer, the median age is 58 years. The association between age and liver cancer risk is well-established, with an elevated likelihood observed as individuals advance in age. This correlation may be attributed to the cumulative effect of exposure to risk factors over an extended period. Multiple studies, including investigations by [36-39] have consistently reported an increased risk of liver cancer within the age range of 58 to 68, further substantiating the age-dependent pattern of liver cancer incidence documented in the literature.
Notably, the gender distribution within the subset of individuals diagnosed with liver cancer revealed a striking trend, with a significant majority (60%) being male. The observed gender disparity in liver cancer incidence within the overweight and obese population is a noteworthy finding. This aligns with existing literature that has often reported a higher prevalence of liver cancer among males [40-42]. The reasons behind this gender-specific susceptibility warrant further exploration and may include hormonal, behavioral, or genetic factors that contribute differentially to liver cancer risk. The relatively low overall incidence of liver cancer within the one-year follow-up period emphasizes the need for targeted risk assessment in populations characterized by overweight or obesity. While the overall percentage is relatively small, the significance lies in the identification of individuals at heightened risk within this specific demographic. Understanding the factors contributing to liver cancer development in this context is essential for implementing preventive measures and personalized healthcare strategies.
The positive odds ratio for total bilirubin (TBIL) indicates that higher levels are associated with an increased risk of liver cancer. Elevated levels of Total Bilirubin (TBIL) serve as an indicative marker of liver dysfunction [43], underscoring the critical role of maintaining optimal liver health in the broader context of cancer prevention. The liver plays a central role in metabolizing bilirubin, and deviations from normal TBIL levels may signify disruptions in liver function [44].
The observed positive odds ratio for Prothrombin Time (PT) implies a modest yet noteworthy association with an elevated risk of liver cancer. PT, a measure of blood clotting, is sensitive to liver function, and alterations in PT levels may serve as an indicator of liver dysfunction [45]. This finding underscores the significance of PT as a potential predictive biomarker for liver cancer. Monitoring PT and recognizing its association with liver cancer risk can provide valuable insights for early detection and intervention, enhancing the effectiveness of preventive measures and therapeutic strategies in individuals at risk of liver cancer.
The odds ratio approximating 1 for Aspartate Aminotransferase (AST) suggests a relatively neutral association with liver cancer risk in the context of overweight and obese individuals. This finding implies that, within this specific population, variations in AST levels may not significantly contribute to an increased or decreased risk of liver cancer. While AST is an enzyme associated with liver function [46], its close-to-neutral odds ratio in this context indicates that, among overweight and obese individuals, AST may not be a predominant factor influencing liver cancer risk, highlighting the importance of considering multiple biomarkers for a comprehensive risk assessment.
The markedly low odds ratio in the multivariate analysis for albumin suggests a robust inverse relationship between albumin levels and the risk of liver cancer. Elevated albumin levels appear to be associated with a protective effect, emphasizing the critical role of maintaining optimal liver function and overall health. Albumin, a protein produced by the liver, plays a key role in various physiological processes [22], and its inverse association with liver cancer risk underscores the potential of albumin as a biomarker indicative of liver health. This finding highlights the importance of interventions and lifestyle factors that support and preserve optimal liver function for overall well-being and potential cancer prevention.
Biochemical markers, including calcium and chloride, serve as indicators of liver cancer risk in overweight and obese individuals. The heightened odds for calcium imply a favorable correlation with the risk of liver cancer, signifying that disruptions in calcium homeostasis may be indicative of underlying physiological changes contributing to cancer development [47]. Similarly, the marginally increased odd for chloride suggests a nuanced positive association with liver cancer risk. The nearly neutral odds ratio for alanine aminotransferase (ALT) within the scope of this study indicates that ALT levels exhibit minimal influence on the risk of liver cancer. This observation highlights the intricate nature of liver enzyme dynamics in the context of assessing cancer risk. The nuanced relationship between ALT and liver cancer risk in this study underscores the multifactorial nature of liver health, emphasizing that the interplay of various factors contributes to the overall complexity of understanding the role of specific enzymes in the context of cancer risk assessment.
Feature importance was assessed using an f-score derived from the XGBoost model. These scores reflect the frequency with which a feature is used to split the data across all trees. In the XGBoost model, the top 5 most important features included total bilirubin, platelet, gender, ALP, and AST. These assessments offer insights into which specific variables carry the most weight in predicting liver cancer risk within the context of our study. Understanding the relative importance of these features can aid in refining the predictive model and identifying the key factors that should be closely monitored for individuals at risk of developing liver cancer. Secondly, identifying influential predictive features is crucial as it offers valuable insights into the factors driving liver cancer incidence among overweight and obese patients. Such insights can inform targeted interventions and personalized healthcare strategies, potentially leading to more effective preventive measures and early interventions.
Integrating AI in clinical pathology: Enhancing liver cancer prediction in overweight and obese individuals
Artificial Intelligence (AI) has emerged as a transformative force in various domains, and its applications in healthcare, specifically in clinical pathology, have garnered significant attention. The integration of AI, particularly machine learning models, into clinical practice holds great promise for enhancing diagnostic accuracy, prognostication, and personalized treatment strategies.
AI-powered machine learning models have demonstrated exceptional capabilities in analyzing complex datasets, leading to improved diagnostic accuracy. In clinical pathology, this translates to more precise identification of biomarkers and patterns associated with various diseases, including liver cancer.
One of the key strengths of AI in clinical pathology is its ability to predict disease outcomes before clinical manifestation. The use of predictive models, as exemplified in our study, enables the identification of individuals at high risk of developing liver cancer, facilitating early intervention and preventive measures. The ML models can analyze diverse patient data, including genetic, clinical, and lifestyle factors, to tailor treatment strategies. This personalized approach is particularly relevant in the context of liver cancer, where risk factors vary, and individualized interventions can lead to better patient outcomes. The application of AI in clinical pathology, as exemplified by our study on predicting liver cancer risk, holds immense potential to revolutionize healthcare practices.
Strength and limitations
Firstly, the XGBoost model demonstrated superior predictive accuracy, achieving an impressive area under the receiver operating characteristic curve (AUROC) of 99%. This exceptional performance indicates the model’s efficacy in discriminating between individuals at high and low risk of developing liver cancer within the studied population. The robust predictive capabilities of XGBoost enhance its potential as a valuable tool for early risk identification. Secondly, the utilization of prospective and consistently collected data is a notable strength. By leveraging high-quality data obtained over time, our study captures a comprehensive and reliable representation of the patient cohort. This enhances the generalizability of our findings to similar populations, reinforcing the external validity of the predictive model. Lastly, the successful mitigation of missing values is a critical strength. Addressing missing data ensures the completeness and integrity of the dataset, preventing potential biases and inaccuracies in the model training process. The meticulous handling of missing values contributes to the overall robustness of our predictive model, enhancing its reliability in real-world clinical scenarios.
Nonetheless, we must acknowledge several limitations. Firstly, as with any retrospective study, the potential for coding errors is an inherent limitation. Despite rigorous data quality control measures, the reliance on historical records introduces the possibility of inaccuracies in the documentation of variables. This highlights the importance of cautious interpretation and emphasizes the need for external validation to ensure the reliability of our findings. External validation, particularly through prospective multicenter studies, is an essential step forward. While our study provides valuable insights within the context of the MIMIC III database, assessing the generalizability of our predictive model to diverse populations and healthcare settings is crucial. Prospective studies can provide a more robust evaluation of the model’s performance in real-world clinical scenarios. Additionally, the relatively short follow-up period in our study is acknowledged as a limitation. Extending the duration of follow-up and incorporating larger cohorts would enhance the ability to validate and generalize our findings. A longer observation period would capture a more extensive range of outcomes and strengthen the model’s predictive capabilities over an extended timeframe.
In this study, we’ve showcased the efficacy of machine learning, particularly XGBoost, in accurately predicting liver cancer development in overweight and obese individuals. The identified features are easily accessible to clinicians, allowing seamless integration into electronic health records for real-time risk assessment. With the modifiable nature of obesity-related risk factors, our model holds potential for use in diet and exercise programs to monitor changes in liver cancer risk over time.
Ethics approval
Before embarking on our research endeavors, it was incumbent upon us to diligently adhere to established ethical standards and procedures. This involved the successful completion of mandatory online human research ethics training, as outlined and mandated by PhysioNet Clinical Databases with Certification Number: 55140935.
In alignment with the rigorous standards of data access and handling, we followed prescribed protocols meticulously. Access to sensitive medical data was granted in strict adherence to established guidelines and safeguards, ensuring that all pertinent ethical considerations were upheld. Our commitment to ethical research was further underscored by our unwavering adherence to the principles set forth in the Declaration of Helsinki [48], which is a fundamental framework for conducting medical research involving human subjects. This comprehensive ethical framework ensures that the dignity, rights, safety, and well-being of research participants are paramount and explicitly safeguarded.
Study highlights
This research pioneers an advanced machine learning framework, employing XGBoost, to predict the one-year risk of liver cancer specifically in overweight and obese individuals. Outperforming Random Forest and Logistic Regression models, XGBoost exhibits an impressive 99% AUROC. Notably, identified predictors, including age, gender, and biochemical markers, provide readily available insights for real-time risk assessment. The modifiable nature of obesity as a risk factor positions the model as a potential tool for personalized interventions, heralding a transformative approach to liver cancer prevention. While promising, external validation and considerations for lifestyle factors warrant further exploration.
Author contributions
K Bah, Ns Bah, and AW Jallow conceived the study. K Bah was responsible for the methodology; K Bah, Ns Bah, & AW Jallow managed the software; K Bah, Ns Bah & AW Jallow were responsible for validation; K Bah, Ns Bah & AW Jallow conducted the formal analysis; K Bah, Ns Bah & AW Jallow conducted the investigation; K Bah was responsible for data curation; K Bah wrote the original draft; K Bah, Ns Bah and AW Jallow reviewed and edited the draft. All authors have read and agreed to the published version of the manuscript.
Funding
This study was conducted independently and did not rely on any external financial assistance.
Informed consent: Given that our study solely utilized de-identified data from the MIMIC III database, the necessity for patient consent was waived, aligning with the anonymized nature of the data.
Availability of data: The data used in this study adheres to the data policy and regulations of MIMIC III and can be made available upon reasonable request to the corresponding author.
Competing interests: The authors declare no competing interests.
The authors would like to express their gratitude to MIMIC III for their valuable assistance in giving us the data to do this study.
- Lin L, Li Z, Yan L, Liu Y, Yang H, Li H. Global, regional, and national cancer incidence and death for 29 cancer groups in 2019 and trends analysis of the global cancer burden, 1990-2019. J Hematol Oncol. 2021 Nov 22;14(1):197. doi: 10.1186/s13045-021-01213-z. PMID: 34809683; PMCID: PMC8607714.
- Bosch FX, Ribes J, Díaz M, Cléries R. Primary liver cancer: worldwide incidence and trends. Gastroenterology. 2004 Nov;127(5 Suppl 1):S5-S16. doi: 10.1053/j.gastro.2004.09.011. PMID: 15508102.
- Perz JF, Armstrong GL, Farrington LA, Hutin YJ, Bell BP. The contributions of hepatitis B virus and hepatitis C virus infections to cirrhosis and primary liver cancer worldwide. J Hepatol. 2006 Oct;45(4):529-38. doi: 10.1016/j.jhep.2006.05.013. Epub 2006 Jun 23. PMID: 16879891.
- Saitta C, Pollicino T, Raimondo G. Obesity and liver cancer. Ann Hepatol. 2019 Nov-Dec;18(6):810-815. doi: 10.1016/j.aohep.2019.07.004. Epub 2019 Aug 20. PMID: 31543467.
- Spinelli A, Buoncristiano M, Nardone P, Starc G, Hejgaard T, Júlíusson PB, Fismen AS, Weghuber D, Musić Milanović S, García-Solano M, Rutter H, Rakovac I, Cucu A, Brinduse LA, Rito AI, Kovacs VA, Heinen MM, Nurk E, et al. Thinness, overweight, and obesity in 6- to 9-year-old children from 36 countries: The World Health Organization European Childhood Obesity Surveillance Initiative-COSI 2015-2017. Obes Rev. 2021 Nov;22 Suppl 6:e13214. doi: 10.1111/obr.13214. Epub 2021 Jul 7. PMID: 34235850.
- Kew MC. Hepatocellular carcinoma: epidemiology and risk factors. J Hepatocell Carcinoma. 2014 Aug 13;1:115-25. doi: 10.2147/JHC.S44381. PMID: 27508181; PMCID: PMC4918271.
- Larsson SC, Wolk A. Overweight, obesity and risk of liver cancer: a meta-analysis of cohort studies. Br J Cancer. 2007 Oct 8;97(7):1005-8. doi: 10.1038/sj.bjc.6603932. Epub 2007 Aug 14. PMID: 17700568; PMCID: PMC2360408.
- Sohn W, Lee HW, Lee S, Lim JH, Lee MW, Park CH, Yoon SK. Obesity and the risk of primary liver cancer: A systematic review and meta-analysis. Clin Mol Hepatol. 2021 Jan;27(1):157-174. doi: 10.3350/cmh.2020.0176. Epub 2020 Nov 26. PMID: 33238333; PMCID: PMC7820201.
- Renehan AG, Tyson M, Egger M, Heller RF, Zwahlen M. Body-mass index and incidence of cancer: a systematic review and meta-analysis of prospective observational studies. Lancet. 2008 Feb 16;371(9612):569-78. doi: 10.1016/S0140-6736(08)60269-X. PMID: 18280327.
- Saunders D, Seidel D, Allison M, Lyratzopoulos G. Systematic review: the association between obesity and hepatocellular carcinoma - epidemiological evidence. Aliment Pharmacol Ther. 2010 May;31(10):1051-63. doi: 10.1111/j.1365-2036.2010.04271.x. Epub 2010 Feb 18. PMID: 20175765.
- Johnson AE, Pollard TJ, Shen L, Lehman LW, Feng M, Ghassemi M, Moody B, Szolovits P, Celi LA, Mark RG. MIMIC-III, a freely accessible critical care database. Sci Data. 2016 May 24;3:160035. doi: 10.1038/sdata.2016.35. PMID: 27219127; PMCID: PMC4878278.
- Pigott TD. Handling missing data. The handbook of research synthesis and meta-analysis. 2009. 2: 399-416.
- Ramli MN. Roles of imputation methods for filling the missing values: A review. Advances in Environmental Biology. 2013; 7(12 S2): 3861-3870.
- Arunajadai SG. Stepwise logistic regression. Anesth Analg. 2009 Jul;109(1):285; author reply 285-6. doi: 10.1213/ane.0b013e3181a7b51a. PMID: 19535724.
- Portet S. A primer on model selection using the Akaike Information Criterion. Infect Dis Model. 2020 Jan 7;5:111-128. doi: 10.1016/j.idm.2019.12.010. PMID: 31956740; PMCID: PMC6962709.
- Chen T. Xgboost: extreme gradient boosting. R package version 0.4-2, 2015; 1(4): 1-4.
- Qi Y. Random forest for bioinformatics. Ensemble machine learning: Methods and applications. 2012: 307-323.
- Breiman L. Random forests. Machine Learning. 2001; 45: 5-32.
- Hosmer DW, Lemeshow S, Sturdivant RX. Applied logistic regression. John Wiley & Sons. 2013; 38.
- Sagi O, Rokach L. Approximating XGBoost with an interpretable decision tree. Information Sciences. 2021; 572: 522-542.
- Jakkula V. Tutorial on support vector machine (svm). School of EECS, Washington State University, 2006; 37(2.5): 3.
- Yuwen P, Chen W, Lv H, Feng C, Li Y, Zhang T, Hu P, Guo J, Tian Y, Liu L, Sun J, Zhang Y. Albumin and surgical site infection risk in orthopaedics: a meta-analysis. BMC Surg. 2017 Jan 16;17(1):7. doi: 10.1186/s12893-016-0186-6. PMID: 28093079; PMCID: PMC5238522.
- Deng S. A gradient boosting decision tree approach for insider trading identification: An empirical model evaluation of China stock market. Applied Soft Computing. 2019; 83: 105652.
- Cutler DR, Edwards TC Jr, Beard KH, Cutler A, Hess KT, Gibson J, Lawler JJ. Random forests for classification in ecology. Ecology. 2007 Nov;88(11):2783-92. doi: 10.1890/07-0539.1. PMID: 18051647.
- Titapiccolo JI. Artificial intelligence models to stratify cardiovascular risk in incident hemodialysis patients. Expert systems with applications. 2013; 40(11): 4679-4686.
- Oommen T, Baise LG, Vogel RM. Sampling bias and class imbalance in maximum-likelihood logistic regression. Mathematical Geosciences. 2011; 43: 99-120.
- Boateng EY, Abaye DA. A review of the logistic regression model with emphasis on medical research. Journal of data analysis and information processing. 2019; 7(4): 190-207.
- Shelke MS, Deshmukh PR, Shandilya VK. A review on imbalanced data handling using undersampling and oversampling technique. Int J Recent Trends Eng Res. 2017; 3(4): 444-449.
- Cohen G, Hilario M, Sax H, Hugonnet S, Geissbuhler A. Learning from imbalanced data in surveillance of nosocomial infection. Artif Intell Med. 2006 May;37(1):7-18. doi: 10.1016/j.artmed.2005.03.002. Epub 2005 Oct 17. PMID: 16233974.
- Chawla NV. SMOTE: synthetic minority over-sampling technique. Journal of artificial intelligence research. 2002; 16: 321-357.
- Kim JH. Estimating classification error rate: Repeated cross-validation, repeated hold-out and bootstrap. Computational statistics & data analysis. 2009; 53(11): 3735-3745.
- Berrar D. Cross-Validation. 2019.
- Probst P, Bischl B, Boulesteix AL. Tunability: Importance of hyperparameters of machine learning algorithms. arXiv preprint arXiv:1802.09596, 2018.
- Grislain N, Gonzalvez J. Dp-xgboost: Private machine learning at scale. arXiv preprint arXiv:2110.12770, 2021.
- Qiaona Q. Research progress on machine learning XGBoost algorithm in medicine. Journal of Molecular Imaging. 2021; 44(5): 856-862.
- Le PH, Kuo CJ, Hsieh YC, Chen TH, Lin CL, Yeh CT, Liang KH. Ages of hepatocellular carcinoma occurrence and life expectancy are associated with a UGT2B28 genomic variation. BMC Cancer. 2019 Dec 5;19(1):1190. doi: 10.1186/s12885-019-6409-3. PMID: 31805979; PMCID: PMC6896495.
- Yoo JJ, Lee J, Choi GH, Lee MW, Park DA. A nationwide study on the current treatment status and natural prognosis of hepatocellular carcinoma in elderly. Sci Rep. 2023 Sep 4;13(1):14584. doi: 10.1038/s41598-023-41771-5. PMID: 37666940; PMCID: PMC10477316.
- Yoon JS, Lee HA, Kim HY, Sinn DH, Lee DH, Hong SK, Cho JY, Choi J, Chang Y, Kong HJ, Kim E, Won YJ, Lee JH. Hepatocellular Carcinoma in Korea: an Analysis of the 2015 Korean Nationwide Cancer Registry. J Liver Cancer. 2021 Mar;21(1):58-68. doi: 10.17998/jlc.21.1.58. Epub 2021 Mar 31. Retracted and republished in: J Liver Cancer. 2022 Sep;22(2):207. PMID: 37384267; PMCID: PMC10035724.
- Tohme S, Bou Samra P, Kaltenmeier C, Chidi AP, Varley PR, Tsung A. Radioembolization for Hepatocellular Carcinoma: A Nationwide 10-Year Experience. J Vasc Interv Radiol. 2018 Jul;29(7):912-919.e2. doi: 10.1016/j.jvir.2018.03.018. Epub 2018 May 26. PMID: 29843996.
- Li Q, Cao M, Lei L, Yang F, Li H, Yan X, He S, Zhang S, Teng Y, Xia C, Chen W. Burden of liver cancer: From epidemiology to prevention. Chin J Cancer Res. 2022 Dec 30;34(6):554-566. doi: 10.21147/j.issn.1000-9604.2022.06.02. PMID: 36714347; PMCID: PMC9829497.
- Keng VW, Largaespada DA, Villanueva A. Why men are at higher risk for hepatocellular carcinoma? J Hepatol. 2012 Aug;57(2):453-4. doi: 10.1016/j.jhep.2012.03.004. Epub 2012 Mar 13. PMID: 22425699; PMCID: PMC3506003.
- Wu EM, Wong LL, Hernandez BY, Ji JF, Jia W, Kwee SA, Kalathil S. Gender differences in hepatocellular cancer: disparities in nonalcoholic fatty liver disease/steatohepatitis and liver transplantation. Hepatoma Res. 2018;4:66. doi: 10.20517/2394-5079.2018.87. Epub 2018 Oct 18. PMID: 30687780; PMCID: PMC6347119.
- Fu S, Wu D, Jiang W, Li J, Long J, Jia C, Zhou T. Molecular Biomarkers in Drug-Induced Liver Injury: Challenges and Future Perspectives. Front Pharmacol. 2020 Jan 30;10:1667. doi: 10.3389/fphar.2019.01667. PMID: 32082163; PMCID: PMC7002317.
- Fevery J. Bilirubin in clinical practice: a review. Liver Int. 2008 May;28(5):592-605. doi: 10.1111/j.1478-3231.2008.01716.x. PMID: 18433389.
- Zermatten MG, Fraga M, Calderara DB, Aliotta A, Moradpour D, Alberio L. Biomarkers of liver dysfunction correlate with a prothrombotic and not with a prohaemorrhagic profile in patients with cirrhosis. JHEP Rep. 2020 May 11;2(4):100120. doi: 10.1016/j.jhepr.2020.100120. PMID: 32715285; PMCID: PMC7369360.
- Kalas MA, Chavez L, Leon M, Taweesedt PT, Surani S. Abnormal liver enzymes: A review for clinicians. World J Hepatol. 2021 Nov 27;13(11):1688-1698. doi: 10.4254/wjh.v13.i11.1688. PMID: 34904038; PMCID: PMC8637680.
- Yin J, Yin LY, Freedman ND, Li TY, Dawsey SM, Cui JF, Taylor PR, Liu B, Fan JH, Chen W, Abnet CC, Qiao YL. Independent and Joint Associations between Serum Calcium, 25-Hydroxy Vitamin D, and the Risk of Primary Liver Cancer: A Prospective Nested Case-Control Study. Cancer Epidemiol Biomarkers Prev. 2020 Oct;29(10):2057-2064. doi: 10.1158/1055-9965.EPI-20-0417. Epub 2020 Aug 20. PMID: 32856608; PMCID: PMC8594771.
- Ashcroft RE. The declaration of Helsinki. The Oxford textbook of clinical research ethics. 2008; 141-148.