
More Information
Submitted: July 31, 2023 | Approved: August 14, 2023 | Published: August 16, 2023
How to cite this article: Akpotaire PA, Seriki SA. Assessment and Correlation of Serum Urea and Creatinine Levels in Normal, Hypertensive, and Diabetic Persons in Auchi, Nigeria. Arch Pathol Clin Res. 2023; 7: 007-016.
DOI: 10.29328/journal.apcr.1001035
Copyright License: © 2023 Akpotaire PA, et al. This is an open access article distributed under the Creative Commons Attribution License, which permits unrestricted use, distribution, and reproduction in any medium, provided the original work is properly cited.
Keywords: Serum creatinine; Serum urea; Hypertension; Diabetes; Fasting blood sugar; Co-morbidity

Assessment and Correlation of Serum Urea and Creatinine Levels in Normal, Hypertensive, and Diabetic Persons in Auchi, Nigeria
Akpotaire PA and Seriki SA*
Department of Human Physiology, College of Medical Sciences, Edo State University, Uzairue, Nigeria
*Address for Correspondence: Seriki SA, Department of Human Physiology, College of Medical Sciences, Edo State University, Uzairue, Nigeria, Email: [email protected]
Background/Aim: There has been a progressive rise in the incidence and prevalence of End Stage Renal Disease (ESRD). It has also been observed that the most important reasons for a rapid increase in Chronic Kidney Disease (CKD) patients are the rapidly increasing worldwide incidence of diabetes and hypertension. The present study evaluates the effect of diabetes, hypertension, and comorbid state of hypertension and diabetes (hypertensive-diabetic) on renal function using serum creatinine and urea as markers.
Method: A total number of 120 persons were recruited for the research; 30 controls, 30 hypertensive, 30 diabetic, and 30 hypertensive-diabetic persons. Of the 30 control persons, 18 were females and 12 were males; of the 30 hypertensive subjects, 17 were females and 13 were males; of the 30 diabetics subjects, 20 were females and 10 were males, whereas of the 30 hypertensive-diabetic subjects, 21 were females and 9 were males. In total, there were seventy-six (76) females and 44 males. The respondents were pulled from Central Hospital (Auchi) Diabetic and General Clinic and Auchi Polytechnic Cottage Hospital. Verbal consent was sort and questionnaires were used to extract information regarding biodata and patients’ history of diabetes and hypertension. Height and weight were measured, and blood pressure was determined taken. Blood samples were collected into fluoride oxalate and lithium heparin bottle for the assessment of FBS and (serum urea and creatinine) respectively.
Results: The mean (±SD) serum creatinine was higher in the hypertensive-diabetic group (2.08 ± 1.06) and declined as follows: diabetic group (1.75 ± 1.01), hypertensive group (1.34 ± 0.96) and control group (0.70 ± 0.14). The mean (±SD) serum urea was also found to be higher in the hypertensive-diabetic group (17.5 ± 9.06) and declined as follows: diabetic group (14.5 ± 6.13), hypertensive group (12.7 ± 6.23) and control group (7.18 ± 5.06). There was a positive correlation between serum creatinine and fasting blood sugar The study also established a positive correlation between serum creatinine and blood pressure but not between serum urea and blood pressure with r values of 0.31 and 0.16 respectively.
Conclusion: Good control of blood glucose and blood pressure levels reduces the likelihood of the development of renal impairment which is usually associated with both diabetes and hypertension. Co-morbidity of diabetes and hypertension poses a higher risk of developing renal disease than individual problems of diabetes and hypertension. Serum creatinine and serum urea are important biomarkers for renal impairment hence the two should be monitored on a regular basis for diabetic and hypertensive patients and much more frequently for hypertensive-diabetic patients.
Hypertension and diabetes are chronic medical illnesses that may result in renal failure if not properly treated. The effect of hypertension and diabetes on renal status can be assessed by measuring the level of urea and creatinine in the blood which serve as measures of assessing kidney function.
Hypertension
Hypertension is when a high or raised blood pressure is consistent [1]. It is a global public health challenge [2-4]. Hypertension is a chronic medical condition that manifests as elevated arterial blood pressure [5]. The higher the pressure in blood vessels the harder the heart has to work in order to pump blood [5]. Hypertension co-existing in diabetic patients is associated with accelerated progression of both microvascular (retinopathy and nephropathy) and macrovascular (atherosclerotic) complications [6,7]. A consistent elevation of systolic blood pressure 140 mm Hg and diastolic pressure 90 mm Hg is termed hypertension [3].
The seventh report of the Joint National Committee on prevention, detection, evaluation, and treatment of high blood pressure (JNC 7), defines hypertension as blood pressure of > 140/90 mmHg for all adults except those with diabetes or chronic kidney disease, and blood pressure of >130/80 mmHg for those with diabetes or chronic kidney disease [5]. According to the JNC 7, the following were also adopted: Normal blood pressure < 120/< 80 mmHg, Prehypertension 120 – 139/80 – 89 mmHg, Stage 1 hypertension 140 – 159/90 – 99 mmHg, Stage 2 hypertension ≥ 160/ ≥ 100 mmHg [5].
Hypertension which is one of the most common medical disorders is a leading cause of chronic renal failure when not treated or poorly treated [8] and is clinically manifested as an increase in blood pressure which may progress to affect the structures and functions of vital organs such as heart, brain and kidney; this may eventually lead to organ failure [9-11].
Elevated serum creatinine level (an indicator of chronic renal disease) is associated with poor treatment of hypertension [12]. The potential benefits of earlier referral to a nephrologist for patients with high serum creatinine include identifying and treating renal failure, slowing the rate of decline associated with progressive renal insufficiency, managing the conditions, and facilitating entry into dialysis programs for all patients who might benefit from dialysis [13]. Elevated serum creatinine has been associated with increased mortality in hypertensive persons, the elderly, and patients suffering from myocardial infarction [14].
Diabetes
Diabetes mellitus is characterized by chronic hyperglycemia due to derangement in carbohydrate, fat, and protein metabolism. Diabetes mellitus is associated with absolute or relative deficiencies in insulin secretion, insulin action, or both [15].
Diabetes Mellitus is defined by World Health Organization on the basis of the laboratory finding as fasting venous plasma glucose concentration more than or equal to 7.0 mmol L-1(126 mg/dl) or a random venous plasma glucose concentration more than or equal to 11.1 mmol L-1 (199.9 mg/dl). It can also be defined as a clinical syndrome characterized by hyperglycemia due to absolute or relative deficiency of insulin [6].
Approximately twenty to thirty percent of all diabetics will develop evidence of nephropathy. Diabetic Nephropathy (DN) is characterised by macro albuminuria and abnormal renal function as represented by a reduction in glomerular filtration and a rise in serum urea and creatinine levels [16].
A comparative study of serum creatinine levels in fifty normal and fifty hypertensive persons carried out in a research laboratory, Department of Physiology, Jorhat Medical College and Hospital, Jorhat, Assam, India revealed that serum creatinine level is higher in hypertensive patients (p < 0.01) than normal subjects [17].
Studies on the evaluation of serum creatinine in hypertensive patients: Medical College Teaching Hospital, Biratnagar, Nepal revealed that serum creatinine is significantly increased in hypertensives with a mean of 1.17 ± 0.25 when compared to the control group’s mean of 1.05 ± 0.14 with p = 0.002 [18].
In a study that was conducted by Chutani and Pande in India on the correlation of serum creatinine and urea with glycemic index and duration of diabetes in diabetes mellitus, there was a statistically significant increase in serum urea and creatinine levels in diabetic subjects compared to non-diabetic subjects and they concluded that serum urea and creatinine are useful, simple biomarkers as a predictor and prognostic tests of renal failure in diabetic patients [19].
A study on Serum urea, uric acid, and creatinine levels in diabetic mellitus patients attending Jos University Teaching Hospital, North Central Nigeria revealed that levels of serum urea (7.9 ± 3.8) and creatinine (200 ± 7.8) uMol/L significantly increased (p < 0.05) in diabetic subjects. This study, therefore, confirms that the assay of serum urea and creatinine concentrations has an important role in the management of diabetic mellitus patients [20].
A study showed that the duration and severity of diabetes strongly correlated with serum urea levels, but not so with serum creatinine levels [15]. This finding is in accordance with the fact that serum creatinine and urea are established markers of Glomerular Filtration Rate (GFR). Serum creatinine is a more sensitive index of kidney function compared to serum urea level. This is because creatinine fulfils most of the requirements for a perfect filtration marker [21,22].
Creatinine
Creatine is a molecule used as a source of high-energy phosphate that can be utilized by tissues for the production of ATP (adenosine triphosphate). Creatine either comes from the diet or is synthesized from the amino acids arginine, glycine, and methionine, this synthesis occurs in the kidneys and liver, although other organ systems may be involved. Creatine and phospho-creatine are converted non-enzymatically to the metabolite creatinine, which diffuses into the blood and is excreted by the kidneys. Creatinine is formed spontaneously from phospho-creatine and is solely eliminated from the body by the kidneys [23].
Urea
Urea is produced in the liver via the urea cycle as a means to remove excess nitrogen from the body. Urea enters the bloodstream, becomes concentrated in the kidneys, and is excreted during urination. Urea is found in other body fluids such as gastric acid, sweat, and saliva. In normal conditions, twenty to thirty percent of the urea synthesized is hydrolysed by the action of bacterial urease in the gastrointestinal tract [24].
Hypertension and Diabetes co-morbidity
Hypertension is an extremely common co-morbidity amongst persons with Diabetes Mellitus (DM) and is said to be twice more prevalent in diabetics than in non-diabetic individuals [7]. It has also been shown that hypertension in diabetic persons is associated with accelerated progression of both microvascular (retinopathy, nephropathy, and neuropathy) and macrovascular (atherosclerotic) compli-cations [25].
Hypertension and diabetes are comorbidities though they also exist in isolation: Both disease states cause subtle damage to the kidney. Most renal impairments are noticed after the kidney had suffered much damage from poorly controlled hypertension [26,27].
Serum urea and creatinine are known to be raised with hyperglycemia in uncontrolled diabetics and usually correlate with the severity of kidney damage. Measurement of serum urea and creatinine are easily available tests for this purpose which can assist in the detection and prevention of diabetic kidney disease at an early stage and can limit the progression to end-stage renal disease [26,27]. Routine assessment of serum creatinine and urea level will serve as a guide for early detection of renal impairment in hypertensive and diabetic patients.
Most available studies either assess the effect of diabetics or hypertension on renal function, this study assessed the combined effect of both hypertension and diabetes on renal function and related it with the effects of isolated cases of hypertension or diabetes on renal function.
The present study evaluates the effect of diabetes and hypertension on renal function using serum urea and creatinine as markers of renal failure. This is achieved by assessing serum urea and creatinine level in diabetic, hypertensive, and hypertensive-diabetic individuals.
This study also compared the serum urea and creatinine level in hypertensive patients with normal subjects, as well as compared the serum urea and creatinine level in diabetic patients with normal subjects. It also assessed the combined effect of hypertension and diabetes on serum urea and creatinine levels.
Mercury sphygmomanometer, Picric acid, Sodium hydroxide, Plain bottles, Fluoride oxalate bottles, 5 ml syringe, Latex hand gloves, Standiometer, Facemask, and Spectrophotometer were among the apparatus used for the study. Pipetting devices were also used for the delivery of 50 µl, 100 µl, 200 µl, 1ml, and 2 ml as well as timing device and water bath to maintain temperature at 25, 30 or 37 oC.
Study area/populations
This study was carried out among patients attending clinics in Cottage Hospital and Central Hospital Auchi, Etsako West Local Government Area of Edo State.
Inclusion criteria: Diabetic patients, Hypertensive patients, Patients aged 25 years and above.
Exclusion criteria: Patients with established renal failure.
Sample size determination
The sample size was calculated using the formula:
Where;
Z = 1.96 (for 95% confidence level).
P = Prevalence rate = 6 % [18].
C = 0.05 (confidence interval).
The minimum sample size (N) = 87.
The study was carried out on 120 subjects divided into four groups
a. Group 1 - Hypertensive non-diabetic subjects n = 30
b. Group 2 - Diabetic non-hypertensive subjects n = 30
c. Group 3 - Hypertensive diabetic subjects n = 30
d. Control groups - Non-hypertensive, non-diabetic subjects n = 30
Research design
This research was designed to study the effect of hypertension and diabetics on renal function among patients attending clinics in Cottage Hospital and Central Hospital Auchi, Etsako West Local Government Area of Edo State.
The sampling method was simple random sampling.
Ethical approval/consideration
Ethical approval was obtained from the Ethical Committee of Edo State Hospitals Management Board, Benin City, Edo State to collect blood samples from hypertensive and diabetic subjects attending clinics in Cottage Hospital and Central Hospital Auchi, Etsako West Local Government Area of Edo State. Approval No: EDSMH/23/102701.
Respondents were informed of the nature and scope of the study and their permission was obtained before samples were collected from them. Only interested patients were included in the study.
Measurement of blood pressure
Blood pressure was measured by an indirect method using a sphygmomanometer.
Sample collection
About five 5 ml of blood were collected into plain bottles. The samples were analysed within six hours of collection for serum urea and creatinine and fasting blood glucose.
Measurement of plasma glucose using the oxidase-peroxidase method
Principle: Glucose Oxidase (GOD) catalyzes the oxidation of glucose to give hydrogen peroxide (H2O2), the hydrogen peroxide is broken down and the oxygen released reacts with 4- aminophenazone (4-aminoantipyrine) and phenol to give a pink colour. This reaction is catalyzed by Peroxidase (POD). The absorbance of the colour produced is measured in a colorimeter using a green filter at 520 nm or in a spectrophotometer at 515 nm [28].
Procedure: Tubes were labelled as reagent blank, standard, control, and sample. One thousand millilitres (1000 ml) of glucose working reagent was pipetted into the test tubes. There was a transfer of 0.01 microliter of distilled water, standard, and sample (plasma) to their respective tubes. Mixed and incubated for 25 minutes at 15 oC - 25 oC. The absorbance of the standard and sample was measured against the reagent blank within 60 minutes at 546 nm [29]
Concentration of glucose in plasma:
∆A Sample/∆A Standard X Standard conc. (mg/dl or mmol/l)
Measurement of serum urea using berthelot method
Principle: Urea is converted to ammonium by the use of urease. The ammonium ion then reacts with a mixture of salicylate, sodium nitroprusside, and hypochloride to yield a blue-green chromophore. The intensity of the colour formed is proportional to the urea concentration in the sample.
Procedure: Using the Berthelot method, each test tube was labelled as reagent blank, standard, control, and sample. One thousand and five hundred millilitres (1500 ml) of urea enzyme reagent were pipetted into the test tubes. There was a transfer of 0.0l microlitres of distilled water, standard, and sample to their respective tubes. Mixed and incubated for 10 minutes at 15 oC - 25 oC. 1.5 ml of the colour developer was added and mixed gently and re-incubated for 10 minutes at 15 oC - 25 oC. The absorbance of the standard and sample was measured against the reagent blank using a spectrophotometer within 60 minutes at a wavelength of 630 nm [30].
Concentration of urea in plasma or serum is then estimated with the formula:
∆A Sample/∆A Standard X Standard conc. (mg/dl)
Jaffe-slot alkaline picrate creatinine method
Principle: Creatinine reacts with picric acid in an alkaline medium. The absorbance of the yellow-red colour produced is measured in a colorimeter using a blue-green filter at 490 nm or in a spectrophotometer at 490 nm wavelength. The amount of the complex formed is directly proportional to the creatinine concentration [28].
Procedure: Working reagent: mixed equal volume of picric acid (500 ml reagent 1) and sodium hydroxide (500 ml reagent 2), kept to be stable for 3 days at +15 to 25 oC.
Serum creatinine was determined using the Jaffe Slot Alkaline Picric Acid method. Test tubes were labelled as standard, control, and sample. One thousand millilitres (1000 ml) of creatinine working reagent was pipetted into respective test tubes. There was a transfer of 0.1 ml microlitres of standard and sample to their respective tubes. Mixed and read after 30 seconds the absorbance A1 of the standard and sample using a spectrophotometer at 492 nm wavelength. Exactly 2 minutes later, read absorbance A2 of standard and sample [31].
Concentration of creatinine in plasma or serum:
∆A Sample/∆A Standard X Standard conc. (mg/dl or mmol/l)
Statistical analysis
The results were analysed using the Statistical Package for Social Sciences (SPSS) version 21. The significance of the difference of the mean was calculated using Analysis of Variance (ANOVA).
Table 1 shows the anthropometric measurements in non-diabetic non-hypertensive subjects (control group), hypertensive, diabetic, and hypertensive-diabetic subjects.
| Table 1: Comparison among study groups for anthropometric parameters. | |||||
| Parameter | Groups | N | Mean ± SD | One-way ANOVA test | |
| F value | p value | ||||
| Age (years) | Control | 30 | 44.87 ± 9.45 | 10.64 | 0.000 |
| Hypertensive | 30 | 50.47 ± 14.55 | |||
| Diabetic | 30 | 56.57 ± 12.58 | |||
| Hypertensive-diabetic | 30 | 60.47 ± 8.42 | |||
| Height (M) | Control | 30 | 1.65 ± 0.08 | 1.843 | 0.143 |
| Hypertensive | 30 | 1.64 ± 0.08 | |||
| Diabetic | 30 | 1.61 ± 0.08 | |||
| Hypertensive-diabetic | 30 | 1.62 ± 0.06 | |||
| Weight (kg) | Control | 30 | 71.57± 11.25 | 2.639 | 0.053 |
| Hypertensive | 30 | 76.80 ± 15.56 | |||
| Diabetic | 30 | 68.17 ± 13.53 | |||
| Hypertensive-diabetic | 30 | 75.10 ± 10.90 | |||
| BMI (kg/m2) | Control | 30 | 26.37 ± 3.86 | 2.260 | 0.085 |
| Hypertensive | 30 | 28.43 ± 5.43 | |||
| Diabetic | 30 | 26.24 ± 4.30 | |||
| Hypertensive-diabetic | 30 | 28.52 ± 4.55 | |||
| ANOVA: Analysis of Variance, BMI: Body Mass Index, SD: Standard Deviation p < 0.005 is considered significant. |
|||||
There was a significant difference in age but no significant difference in height, weight, and BMI.
Table 2 shows the mean values of FBS (fasting blood sugar), Creatinine, urea, systolic, and diastolic blood pressure of respondents.
| Table 2: Mean values of FBS, creatinine and urea, and blood pressure of respondents. | |||||
| Parameter | FBS (mg/dl) |
Creatinine (mg/dl) | Urea (mg/dl) |
Systolic BP (mmHg) |
Diastolic BP (mmHg) |
| Mean | 121.0100 | 1.46 | 13.0112 | 130.60 | 80.68 |
| SD | 59.17937 | 1.01 | 7.70596 | 20.36 | 13.72 |
In Table 3, there is a statistical difference in the comparison of means among the various groups of fasting blood sugar, creatinine, and urea.
| Table 3: Comparison among study groups for FBS, serum creatinine and urea. | |||||
| Parameter | Groups | N | Mean ± SD | One-way ANOVA test | |
| F value | p value | ||||
| FBS (mg/dl) | Control | 30 | 83.81 ± 8.72 | 19.27 | 0.000 |
| Hypertensive | 30 | 92.03± 13.30 | |||
| Diabetic | 30 | 164.34 ± 72.11 | |||
| Hypertensive-diabetic | 30 | 143.9 ± 64.34 | |||
| Creatinine (mg/dl) | Control | 30 | 0.70 ± 0.14 | 13.37 | 0.000 |
| Hypertensive | 30 | 1.34 ± 0.96 | |||
| Diabetic | 30 | 1.75 ± 1.01 | |||
| Hypertensive-diabetic | 30 | 2.08 ± 1.06 | |||
| Urea (mg/dl) | Control | 30 | 7.18± 5.06 | 12.40 | 0.000 |
| Hypertensive | 30 | 12.7 ± 6.23 | |||
| Diabetic | 30 | 14.5 ± 6.13 | |||
| Hypertensive-diabetic | 30 | 17.5 ± 9.06 | |||
| ANOVA: Analysis of Variance, BMI: Body Mass Index, SD: Standard Deviation, FBS (Fasting Blood Sugar) p < 0.05 is considered significant. |
|||||
In Table 4, there is a statistical difference in the diastolic and systolic blood pressure among the study groups.
| Table 4: Comparison among study groups for blood pressure. | |||||
| Parameter | Groups | N | Mean ± SD | One-way ANOVA test | |
| F value | p value | ||||
| Systolic BP (mmHg) | Control | 30 | 115.43 ± 14.37 | 27.495 | 0.000 |
| Hypertensive | 30 | 146.17 ± 22.11 | |||
| Diabetic | 30 | 120.13 ± 11.58 | |||
| Hypertensive-diabetic | 30 | 140.67 ± 12.83 | |||
| Diastolic BP (mmHg) | Control | 30 | 73.43 ± 7.74 | 25.940 | 0.000 |
| Hypertensive | 30 | 91.63 ± 14.60 | |||
| Diabetic | 30 | 71.1 ± 8.32 | |||
| Hypertensive-diabetic | 30 | 86.60 ± 10.97 | |||
| ANOVA: Analysis of Variance, BMI: Body Mass Index, SD: Standard Deviation p < 0.005 is considered significant. |
|||||
In Table 5, there is a statistical difference between the control group and the diabetic and hypertensive diabetic groups.
| Table 5: Multiple comparisons for creatinine using LSD. | ||
| Group | Comparison | p value |
| Control | hypertensive | 0.006 |
| diabetic | 0.000 | |
| hypertensive-diabetic | 0.000 | |
| Hypertensive-Diabetic | hypertensive | 0.001 |
| diabetic | 0.112 | |
| Diabetic | hypertensive | 0.100 |
| p < 0.005 is significant, Standard error = 20.12945. The mean difference is significant at the 0.05 level. | ||
There is statistical significance between the hypertensive diabetic group and the hypertensive group.
In Table 6, there is a significant difference in only the control group with the three studied groups.
| Table 6: Multiple comparisons for urea using LSD. | ||
| Group | Comparison | p value |
| Control | hypertensive | 0.002 |
| diabetic | 0.000 | |
| hypertensive-diabetic | 0.000 | |
| Hypertensive-diabetic | hypertensive | 0.007 |
| diabetic | 0.087 | |
| Diabetic | hypertensive | 0.305 |
| p < 0.05 is significant, Standard error = 1.75351. The mean difference is significant at the 0.05 level. | ||
In Figure 1, there is a statistical difference in the comparison of means FBS among the various groups with the diabetic group having a higher value (164.34 ± 72.11) mg/dl. p = 0.000.
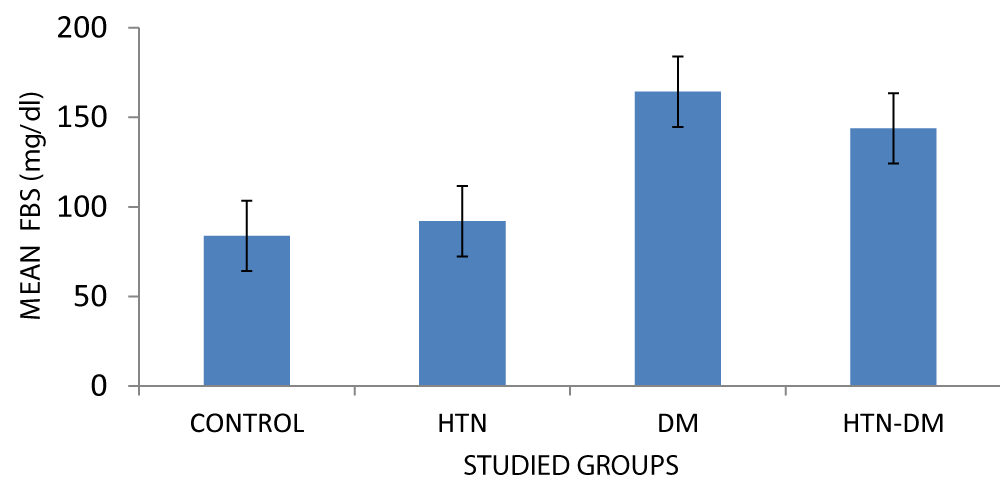
Figure 1: Comparison among study groups for FBS.
The mean systolic and diastolic blood pressures were higher in the hypertensive group.
p < 0.05 is considered significant as seen in Figure 2.
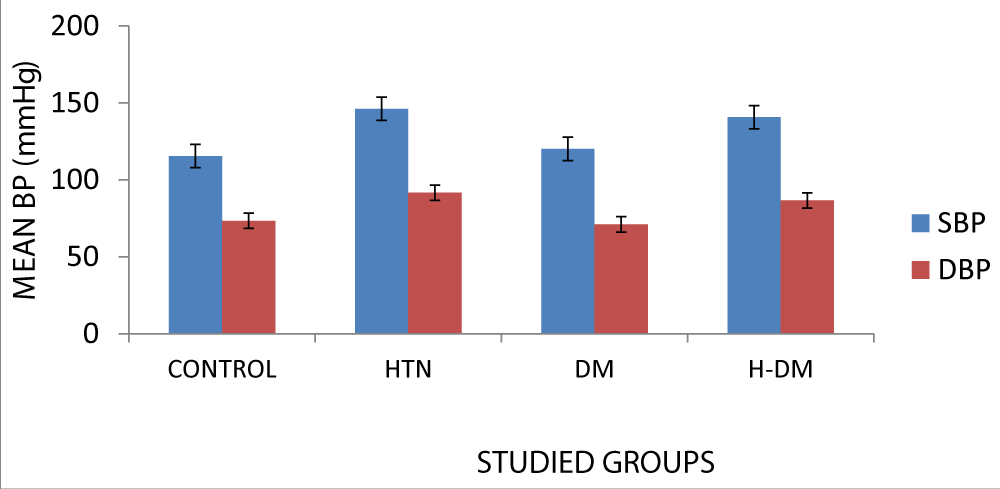
Figure 2: Comparison among study groups for blood pressure. H: Hypertensive, DM: Diabetic, H-DM: Hypertensive-diabetic SBP: Systolic Blood Pressure, DBP: Diastolic Blood Pressure, BP: Blood Pressure
There is a statistical difference in the diastolic and systolic blood pressures among the study groups.
In Figure 3, the hypertensive-diabetic group had a higher mean creatinine value (2.08).
Figure 3: Mean creatinine levels of respondents.
The serum creatinine level increases in the order seen in the graph. Serum creatinine levels are visibly higher in diabetics in comparison to the non-diabetic control group [15].
There was a significant difference when the control group was compared with the hypertensive group (p = 0.006), diabetic group (p = 0.000), and hypertensive diabetic group (0.000).
There was a significant difference when the hypertensive diabetic group was compared with the hypertensive group
(p = 0.001), but not for the diabetic group (p = 0.112).
There was no significant difference between serum urea in the hypertensive and diabetic groups (p = 0.100).
The mean (± SD) serum creatinine for the control group was found to be 0.70 ± 0.14 while that of the hypertensive group was 1.34 ± 0.96 (p = 0.006), this is statistically significant and is in line with findings by Yadav, 2016 who stated that there was a significant increase in level of serum creatinine among hypertensive subject when compared with non-hypertensive subjects.
As seen in Figure 4, the hypertensive-diabetic group had a higher mean urea value (17.57).
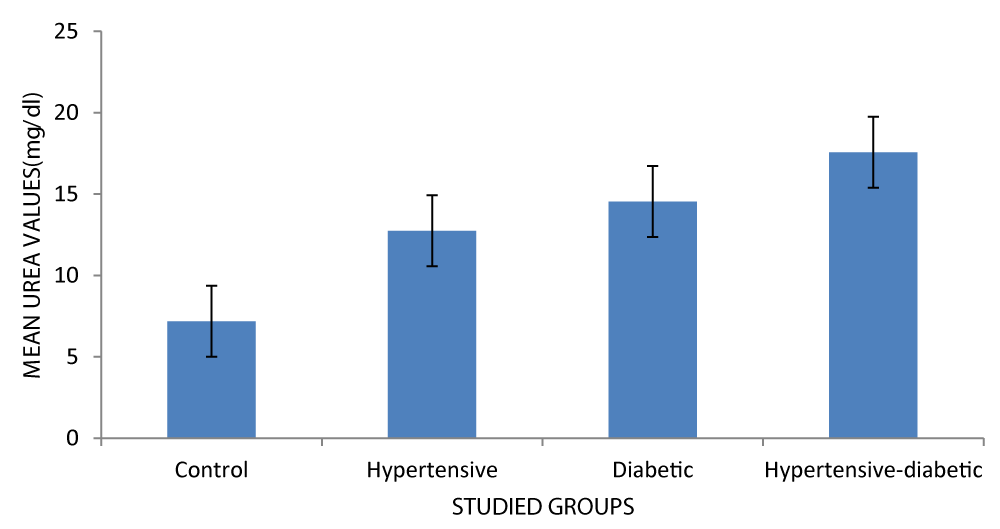
Figure 4: Mean urea level of respondents.
The serum urea level increases in the order seen in the graph. Serum urea levels are visibly higher in diabetics in comparison with the non-diabetic control group [15].
There were significant differences when the control group was compared with the hypertensive group (p = 0.002), diabetic group (p = 0.000), and hypertensive diabetic group (0.000).
There was a significant difference when the hypertensive diabetic group was compared with the hypertensive group (p = 0.007), but not for the diabetics group (p = 0.087).
There was no significant difference between serum urea in the hypertensive and diabetic groups (p = 0.305).
There was a positive correlation between serum urea and FBS as shown in Figure 5. There was a strong positive correlation between serum urea and FBS levels [15].
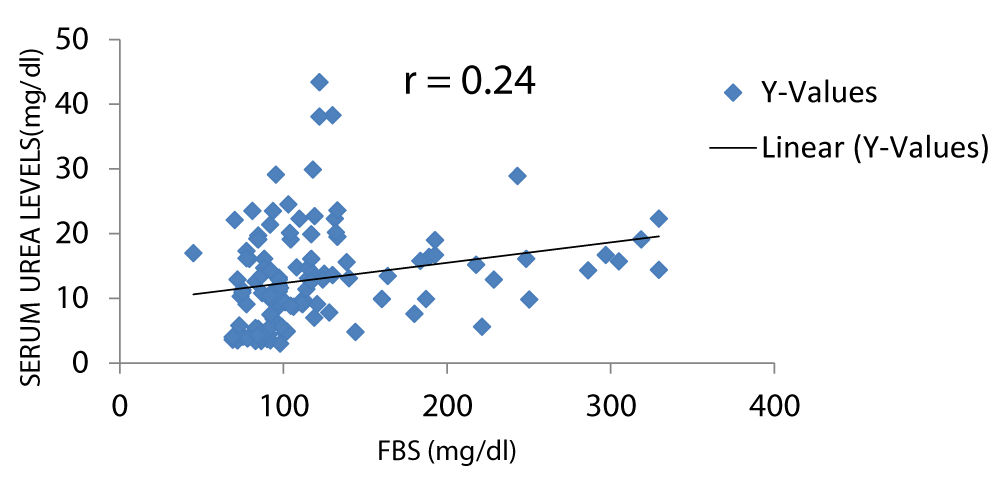
Figure 5: A scatter plot showing correlation between serum urea and FBS.
Figure 6 shows that there was a positive correlation between serum Cr and FBS. Bamanikar, et al. stated that there was a weak positive correlation between serum Cr and FBS levels [15].
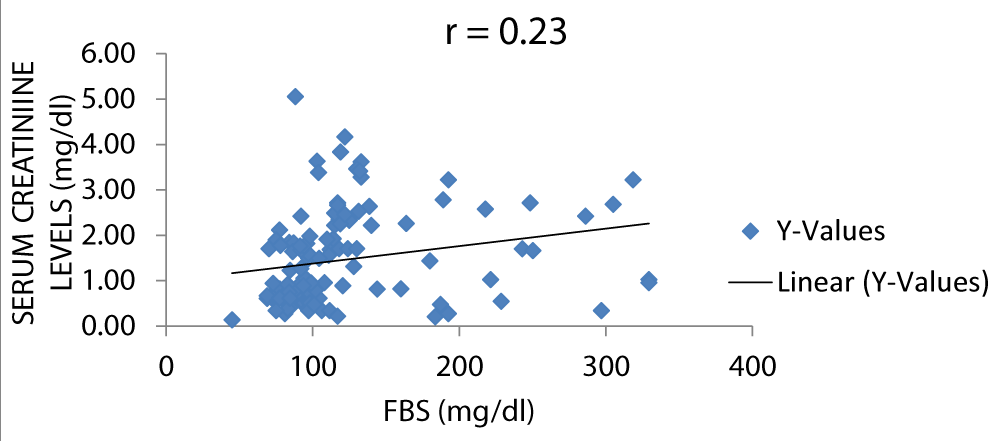
Figure 6: A scatter plot showing correlation between serum creatinine and FBS.
There was a positive correlation between serum urea and SBP (systolic blood pressure) as displayed in Figure 7.
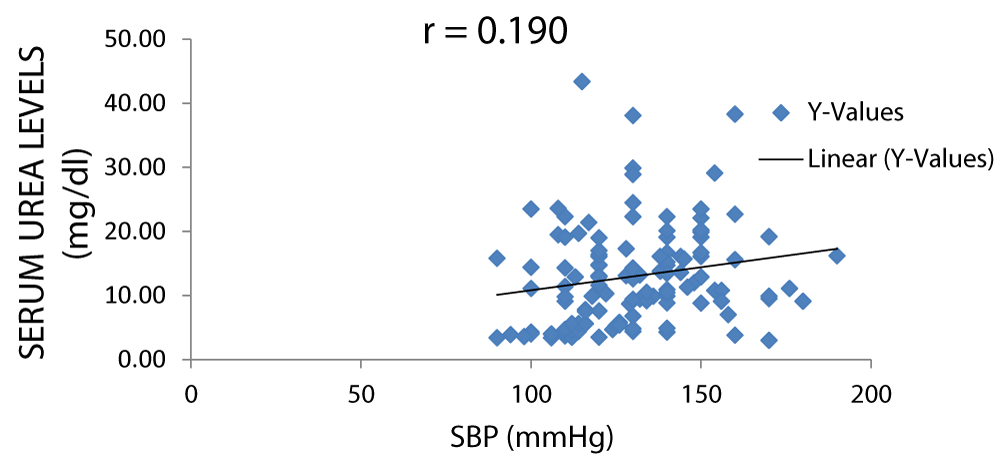
Figure 7: A scatter plot showing correlation between serum urea and SBP.
There was a positive correlation between serum urea and DBP (diastolic blood pressure) as shown in Figure 8.
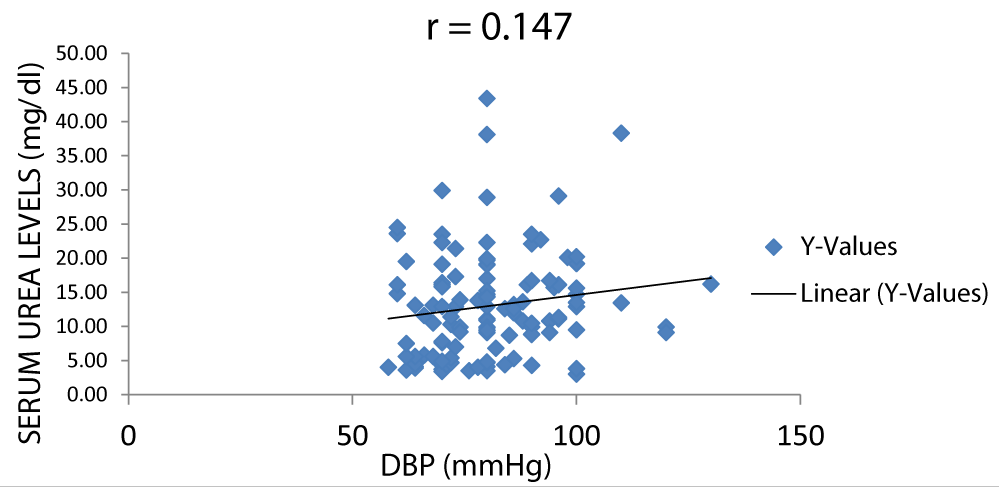
Figure 8: A scatter plot showing correlation between serum urea and DBP.
Figure 9 shows that there was a positive correlation between serum urea and DBP (diastolic blood pressure).
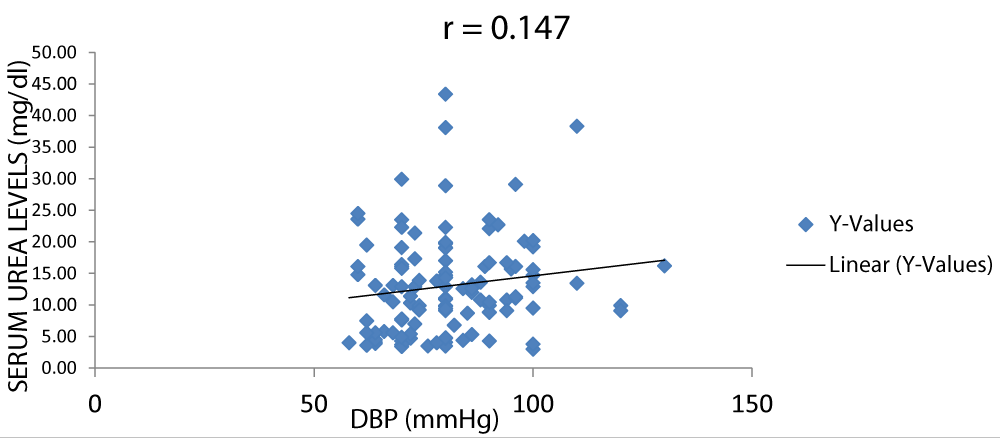
Figure 9: A scatter plot showing correlation between serum urea and DBP.
There was a positive correlation between serum creatinine and DBP (diastolic blood pressure) as seen in Figure 10.
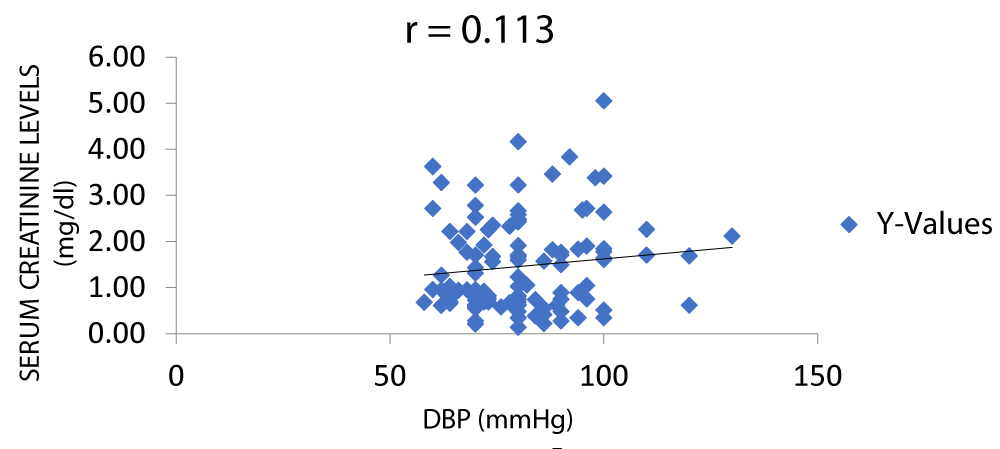
Figure 10: A scatter plot showing correlation between serum creatinine and DBP.
In Figure 11, there was a positive correlation between serum creatinine and SBP (systolic blood pressure).
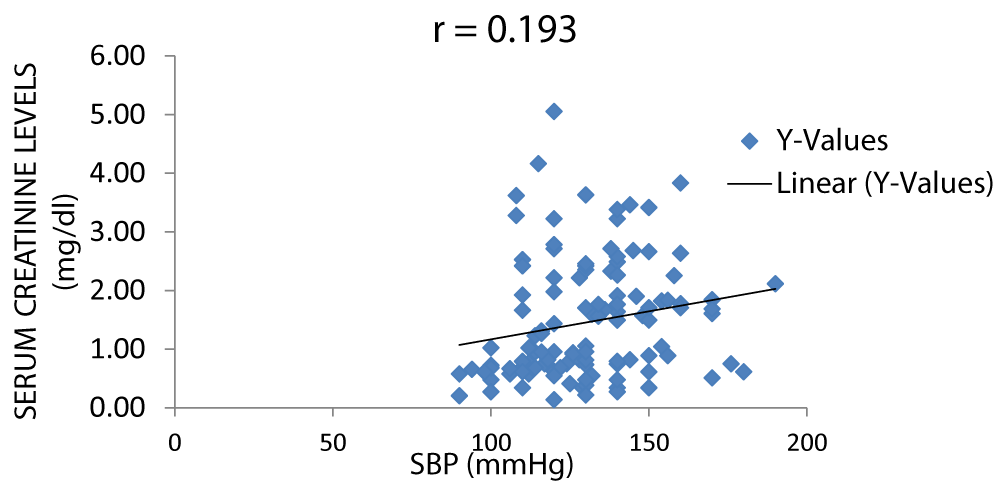
Figure 11: A scatter plot showing correlation between serum creatinine and SBP.
Summary of findings
The total numbers of respondents were one hundred and twenty, (30 controls, 30 hypertensive, 30 diabetic & 30 hypertensive-diabetic). Out of the 30 control subjects, 18 were females and 12 were males, of the 30 hypertensive subjects 17 were females and 13 were males, of the 30 diabetics subjects 20 were females and 10 were males, whereas amongst hypertensive-diabetic subjects were 21 females and 9 were males. In total, there were seventy-six (76) females and 44 males.
The mean (±SD) serum creatinine for the control group was found to be 0.70 ± 0.14 while that of the hypertensive group was 1.34 ± 0.96, the diabetic group was 1.75 ± 1.01 and the hypertensive-diabetic group was 2.08 ± 1.06.
The mean (±SD) serum urea for the control group was 7.18 ± 5.06, hypertensive group 12.7 ± 6.23, diabetic group, 14.5 ± 6.13, and that of the hypertensive-diabetic group was 17.5 ± 9.06
The mean serum creatinine and urea were higher for the hypertensive-diabetic group.
There was also a significant difference in serum creatinine level between the control group (1.65 ± 0.08) and the hypertensive-diabetic group (1.62 ± 0.08), (p = 0.000) though there was no significant difference between the control and the hypertensive group (p = 0.006).
A significant difference was also noted between the hypertensive-diabetic and the hypertensive group (p = 0.001) though there was no significant difference between the hypertensive-diabetic and the diabetic group (p = 0.112).
There was no significant difference between the hypertensive and diabetic groups (p = 0.100).
The recent rise in incidence and prevalence of End Stage Renal Disease (ESRD) has risen progressively [30] and is very much attributable to the rapidly increasing worldwide incidence of diabetes and hypertension (Figures 1,2) [31,32].
This study examined the effects of hypertension and diabetes on renal function using serum urea and creatinine as markers for renal function. This was done by comparing the levels of serum urea and creatinine in patients who are hypertensive, diabetic, and hypertensive-diabetic with a control group (Figures 1,2).
Assessment of serum urea revealed that there was a significant difference between the control group and the hypertensive group, (p = 0.002) control group and the diabetic group, (p = 0.000), the control group and the hypertensive-diabetic group, (p = 0.000).
There was no significant difference between the hypertensive-diabetic group and the hypertensive group (p = 0.007), there was also no significant difference between the hypertensive-diabetic and the diabetic group (p = 0.087), the comparison between the diabetic group and the hypertensive group shows that there was also no significant difference (p = 0.305) (Figures 1,2).
Comparison of serum creatinine, serum urea levels between control and hypertensive groups
The mean (±SD) serum creatinine for the control group was found to be 0.70 ± 0.14 while that of the hypertensive group was 1.34 ± 0.96 (p = 0.006) (Figure 3).
The mean (±SD) serum urea for the control group was 7.18 ± 5.06, hypertensive group 12.7 ± 6.23 (p = 0.002) (Figure 4).
Comparison of serum creatinine, serum urea levels between control and diabetic groups
The mean (±SD) serum creatinine for the control group was found to be 0.70 ± 0.14 and that of the diabetic group was 1.75 ± 1.01, (p = 0.000) (Figure 3).
The mean (±SD) serum urea for the control group was 7.18 ± 5.06 while that of the diabetic group was, 14.5 ± 6.13, (p = 0.000) (Figure 4).
It was observed that the mean serum creatinine and urea were higher in the diabetic group than the control group which is in accordance with a Study on Serum urea and Creatinine in Diabetic and non-diabetic patients in a tertiary teaching hospital [15]. This showed that the mean serum urea and creatinine levels were visibly higher in the diabetics in comparison to the non-diabetic control group.
Comparison of serum creatinine, serum urea levels between control and hypertensive-diabetic groups
The mean (±SD) serum creatinine for the control group was found to be 0.70 ± 0.14 and the hypertensive-diabetic group was 2.08 ± 1.06. The mean (±SD) serum urea for the control group was 7.18 ± 5.06 while that of the hypertensive-diabetic group was 17.5 ± 9.06. (p = 0.007) (Figures 3,4).
It was observed that the mean serum creatinine and urea were higher in the hypertensive-diabetic group than in the control group.
Comparison of serum creatinine, serum urea levels between hypertensive-diabetic and hypertensive groups
The mean (±SD) serum creatinine was higher in the hypertensive-diabetic group (2.08 ± 1.06) than hypertensive group (1.34 ± 0.96), (p = 0.001).
The mean (±SD) serum urea was higher in the hypertensive-diabetic group (17.5 ± 9.06) than hypertensive group (12.7 ± 6.23), (p = 0.007).
Comparison of serum creatinine, serum urea levels between hypertensive-diabetic and diabetic groups
The mean (±SD) serum creatinine was higher in the hypertensive-diabetic group (2.08 ± 1.06) than diabetic group (1.75 ± 1.01), (p = 0.112).
The mean (±SD) serum creatinine was higher in the hypertensive-diabetic group (17.5 ± 9.06) than diabetic group (14.5 ± 6.13), (p = 0.087).
Comparison of serum creatinine, serum urea levels between hypertensive and diabetic groups
The mean (±SD) serum creatinine was lower in the hypertensive group (1.34 ± 0.96) than diabetic group (1.75 ± 1.01), (p = 0.100).
The mean (±SD) serum urea was lower in the hypertensive group (12.7 ± 6.23) than diabetic group (14.5 ± 6.13), (p = 0.305).
Correlation between serum creatinine, serum urea, and FBS
There was a positive correlation between serum creatinine and fasting blood sugar and between serum urea and fasting blood sugar with r values of 0.23 and 0.24 respectively, this is in keeping with the study by Bamanikar, et al. which stated that there was a strong positive correlation between the serum urea levels and fasting blood sugar level (Figures 5,6) [15].
Correlation between serum creatinine, serum urea, and blood pressure
There was a positive correlation between serum creatinine and blood pressure but not between serum urea and blood pressure with r values of 0.31 and 0.16 respectively (Figures 7-11).
Good control of blood glucose and blood pressure level reduces the likelihood of the development of renal impairment which is usually associated with both diabetes and hypertension.
Co-morbidity of diabetes and hypertension poses a higher risk of developing renal disease.
Both serum creatinine and serum urea are important biomarkers for renal impairment hence should be monitored on a regular basis for diabetic and hypertensive patients and much more frequently for hypertensive-diabetic patients.
Both blood serum urea and serum creatinine levels increase significantly in hypertensive and diabetic patients with a marked increase in the co-morbid state hence should be monitored more frequently to ensure early detection of renal impairment.
- World Health Organization. World Health Day 2013: Silent Killer, Global Public Health Crisis. WHO Campaigns. 2013a.
- Kearney PM, Whelton M, Reynolds K, Muntner P, Whelton PK, He J. Global burden of hypertension: analysis of worldwide data. Lancet. 2005 Jan 15-21;365(9455):217-23. doi: 10.1016/S0140-6736(05)17741-1. PMID: 15652604.
- WHO. Global burden of disease report. World Health Organisation, Geneva. 2008.
- Lim SS, Vos T, Flaxman AD, Danaei G, Shibuya K, et al. A comparative risk assessment of burden of disease and injury attributable to 67 risk factors and risk factor clusters in 21 regions, 1990-2010: a systematic analysis for the Global Burden of Disease Study 2010. Lancet. 2012 Dec 15;380(9859):2224-60. doi: 10.1016/S0140-6736(12)61766-8. Erratum in: Lancet. 2013 Apr 13;381(9874):1276. Erratum in: Lancet. 2013 Feb 23;381(9867):628. AlMazroa, Mohammad A [added]; Memish, Ziad A [added]. PMID: 23245609; PMCID: PMC4156511.
- Chobanian AV, Bakris GL, Black HR, Cushman WC, Green LA, Izzo JL Jr, Jones DW, Materson BJ, Oparil S, Wright JT Jr, Roccella EJ; Joint National Committee on Prevention, Detection, Evaluation, and Treatment of High Blood Pressure. National Heart, Lung, and Blood Institute; National High Blood Pressure Education Program Coordinating Committee. Seventh report of the Joint National Committee on Prevention, Detection, Evaluation, and Treatment of High Blood Pressure. Hypertension. 2003 Dec;42(6):1206-52. doi: 10.1161/01.HYP.0000107251.49515.c2. Epub 2003 Dec 1. PMID: 14656957.
- Grundy SM, Benjamin IJ, Burke GL, Chait A, Eckel RH, Howard BV, Mitch W, Smith SC Jr, Sowers JR. Diabetes and cardiovascular disease: a statement for healthcare professionals from the American Heart Association. Circulation. 1999 Sep 7;100(10):1134-46. doi: 10.1161/01.cir.100.10.1134. Erratum in: Circulation 2000 Apr 4;101(13):1629-31. PMID: 10477542.
- Epstein M, Sowers JR. Diabetes mellitus and hypertension. Hypertension. 1992 May;19(5):403-18. doi: 10.1161/01.hyp.19.5.403. PMID: 1568757.
- Masoumi A, Reed-Gitomer B, Kelleher C, Schrier RW. Potential pharmacological interventions in polycystic kidney disease. Drugs. 2007;67(17):2495-510. doi: 10.2165/00003495-200767170-00004. PMID: 18034588.
- Pontremoli R, Viazzi F, Martinoli C, Ravera M, Nicolella C, Berruti V, Leoncini G, Ruello N, Zagami P, Bezante GP, Derchi LE, Deferrari G. Increased renal resistive index in patients with essential hypertension: a marker of target organ damage. Nephrol Dial Transplant. 1999 Feb;14(2):360-5. doi: 10.1093/ndt/14.2.360. PMID: 10069189.
- Zhang Q, Davis KJ, Hoffmann D, Vaidya VS, Brown RP, Goering PL. Urinary biomarkers track the progression of nephropathy in hypertensive and obese rats. Biomark Med. 2014;8(1):85-94. doi: 10.2217/bmm.13.106. PMID: 24325231; PMCID: PMC3951143.
- Ritz E. Hypertension and kidney disease. Clin Nephrol. 2010 Nov;74 Suppl 1:S39-43. PMID: 20979962.
- Coresh J, Wei GL, McQuillan G, Brancati FL, Levey AS, Jones C, Klag MJ. Prevalence of high blood pressure and elevated serum creatinine level in the United States: findings from the third National Health and Nutrition Examination Survey (1988-1994). Arch Intern Med. 2001 May 14;161(9):1207-16. doi: 10.1001/archinte.161.9.1207. PMID: 11343443.
- Mendelssohn DC, Barrett BJ, Brownscombe LM, Ethier J, Greenberg DE, Kanani SD, Levin A, Toffelmire EB. Elevated levels of serum creatinine: recommendations for management and referral. CMAJ. 1999 Aug 24;161(4):413-7. PMID: 10478168; PMCID: PMC1230545.
- Wannamethee SG, Shaper AG, Perry IJ. Serum creatinine concentration and risk of cardiovascular disease: a possible marker for increased risk of stroke. Stroke. 1997 Mar;28(3):557-63. doi: 10.1161/01.str.28.3.557. PMID: 9056611.
- Bamanikar SA, Bamanikar AA, Arora A. Study of serum urea and creatinine in diabetic and non-diabetic patients in a tertiary teaching hospital. Journal of Medical Research. 2016; 2(1):12-15.
- Kanwar G, Jain N, Sharma N, Shekhawat M, Ahmed J, Kabra R. Significance of Serum Urea and Creatinine Levels in Type 2 Diabetic Patients. Iosr-Jdms. 2015; 14:65-7.
- Bhattacharjya J, Goswami B. Comparative study of serum creatinine level in normal and hypertensive persons. International Journal of Scientific Study. 2016; 4(2):122-124.
- Shekhar CY. Elevation of serum creatinine in hypertensive patient. Journal of Noble Medical College. 2016; 5(2):56-59.
- Chutani A, Pande S. Correlation of serum creatinine and urea with glycemic index and duration of diabetes in Type 1 and Type 2 diabetes mellitus: A comparative study National Journal of Physiology, Pharmacy, and Pharmacology. 2017; 7:914-919.
- Ediale JR, Adugba OA, Ani OC, Chime UP, Uzoigwe J, Agu UF, Okorie P, Chinemerem N, Onyemaechi BA, Paul C. Serum urea, uric acid, and creatinine levels in diabetic mellitus patients attending Jos University Teaching Hospital, North central Nigeria. International Journal of Biosciences. 2017;11: 68-72.
- Adler AI, Stevens RJ, Manley SE, Bilous RW, Cull CA, Holman RR; UKPDS GROUP. Development and progression of nephropathy in type 2 diabetes: the United Kingdom Prospective Diabetes Study (UKPDS 64). Kidney Int. 2003 Jan;63(1):225-32. doi: 10.1046/j.1523-1755.2003.00712.x. PMID: 12472787.
- Deepa K, Goud MBK, Devi OS, Devaki R, Nayal B, Prabhu A. Serum urea, creatinine in Relation to fasting plasma glucose levels in type 2 diabetics. IJPBS. 2011; 1:279-83.
- Iyengar MR, Coleman DW, Butler TM. Phosphocreatinine, a high-energy phosphate in muscle, spontaneously forms phosphocreatine and creatinine under physiological conditions. J Biol Chem. 1985 Jun 25;260(12):7562-7. PMID: 3997888.
- Zhou C, Bhinderwala F, Lehman MK, Thomas VC, Chaudhari SS, Yamada KJ, Foster KW, Powers R, Kielian T, Fey PD. Urease is an essential component of the acid response network of Staphylococcus aureus and is required for a persistent murine kidney infection. PLoS Pathog. 2019 Jan 4;15(1):e1007538. doi: 10.1371/journal.ppat.1007538. PMID: 30608981; PMCID: PMC6343930.
- Williams B. Insulin resistance: the shape of things to come. Lancet. 1994 Aug 20;344(8921):521-4. doi: 10.1016/s0140-6736(94)91904-6. PMID: 7914619.
- Shlomo M, Polonsky KS, Larsen PR, Kronenberg HM. Diabetes Mellitus. Williams textbook of endocrinology, 12th Ed. Philadelphia: Elsevier/Saunders. 2011;1371-1435.
- Zimmet P, Alberti KG, Shaw J. Global and societal implications of the diabetes epidemic. Nature. 2001 Dec 13;414(6865):782-7. doi: 10.1038/414782a. PMID: 11742409.
- Cheesbrough M. District Laboratory Practice in Tropical Countries. Part 1. Cambridge University Press, U.k. 2004; 333-345.
- Harish J, Srinivas HA. Comparative Study of Glucometer and Laboratory Glucose Oxidase Method for Estimation of Blood Glucose Levels in Neonates. Journal of Evolution of Medical and Dental Sciences. 2015; 4:2652-2663.
- Ihim AC, Ogbodo EC, Oguaka VN, Ozuruoke DF, Okwara EC, Nwovu AI, Amah UK, Abiodun BE. Effect of short-term exposure to formalin on kidney function tests of students in Nnewi. European.Journal of Biomedical and Pharmaceutical Sciences. 2017; 4(12):51-55.
- Ochei J, Kolhatkar J. Medical Laboratory Sciences, Theory and Practice, Sixth Ed. In: Tata McGraw Hill Company Limited. New Delhi. 2007; 182-183.
- Schoolwerth AC, Engelgau MM, Hostetter TH, Rufo KH, Chianchiano D, McClellan WM, Warnock DG, Vinicor F. Chronic kidney disease: a public health problem that needs a public health action plan. Prev Chronic Dis. 2006 Apr;3(2):A57. Epub 2006 Mar 15. PMID: 16539798; PMCID: PMC1563984.
- Seriki SA. Hypertension and Diabetes Risk, Interaction, and Management Target. Journal of Angiology and Circulatory System. 2020; 1:104.
- Singh S, Shankar R, Singh GP. Prevalence and Associated Risk Factors of Hypertension: A Cross-Sectional Study in Urban Varanasi. Int J Hypertens. 2017;2017:5491838. doi: 10.1155/2017/5491838. Epub 2017 Dec 3. PMID: 29348933; PMCID: PMC5733954.