
More Information
Submitted: 15 July 2019 | Approved: 22 July 2019 | Published: 23 July 2019
How to cite this article: Tracy RE. Longitudinal and transverse dimensions of hypertrophied cardiomyocytes in human left ventricle (LV) at autopsy; Heart failure might result from changes in chamber geometry without contractile weakening. Arch Pathol Clin Res. 2019; 3: 015-019. doi: 10.29328/journal.apcr.1001013
Copyright License: © 2019 Tracy RE. This is an open access article distributed under the Creative Commons Attribution License, which permits unrestricted use, distribution, and reproduction in any medium, provided the original work is properly cited.

Longitudinal and transverse dimensions of hypertrophied cardiomyocytes in human left ventricle (LV) at autopsy; Heart failure might result from changes in chamber geometry without contractile weakening
Richard E Tracy*
MD, PhD, Professor Emeritus, Department of Pathology, Louisiana State University Health Sciences Center, Pathologist for Orleans Parish Forensic Center, USA
*Address for Correspondence: Richard E Tracy, MD, PhD, Professor Emeritus, Department of Pathology, Louisiana State University Health Sciences Center, Pathologist for Orleans Parish Forensic Center, 3001 Earhart Blvd, New Orleans LA 70125, USA, Tel: 1-504-568-6072; Fax: 1-504-568-6037; Email: [email protected]; [email protected]
The shapes and sizes of human cardiomyocytes are accessible to systematic observation under most circumstances only at autopsy. This constraint has seriously curbed the study of these topics, thereby leaving a crippling gap in our understanding of heart failure. In recent years the only published ongoing findings have come from this laboratory. This article is a condensation of these reports, using those sources to develop fresh analyses designed to construct a set of organizing principles. The data are entirely retrospective thereby forbidding hypothesis testing and permitting only hypothesis formation. The hypotheses generated in this way are novel and surprising. In spite of the severe limitations in this methodology is seems possible that some useful new directions of inquiry might evolve from pursuing these original observations.
The response of the left ventricular muscle mass to increasing work-loads is usually called hypertrophy and not hyperplasia. The loaded muscle is said to expand only the sizes and not the numbers of myocytes; although this may not be exactly true it does seem to provide a close and useful approximation. The anatomic increase of myocyte size is achieved by adding sarcomeres in either the longitudinal or the transverse dimension or both. These topics are accessible to observation only at autopsy in the human, an arduous practice that has often been circumvented by simply transferring findings in laboratory animals directly to the human. A terse condensation of all available recent reports of findings from autopsies is offered in this review article [1-6].
Cardiomyocytes are oriented in a bewildering web of directions in the radial, longitudinal, and circumferential dimensions of the LV [7-9]. However, some useful simplifications can be derived from approximations that utilize accessible measurements. One such simplification to be used throughout this discourse is the LV spherical model where the image seen in the LV equatorial plane (touching the edges of the opened mitral valve leaflets) can be treated as concentric circles formed by an idealized hollow sphere; these dimensions are often emphasized when reporting findings from echocardiography [10,11]. In the midwall of this plane the bundles of myocytes course in a circumferential direction, and can therefore offer provisionally useful information about structural-functional correlations [12]. This circumference also offers a way to determine average myocyte length using a regression equation reported by Tamura et al. 1998 [13], which determines average myocyte length (MyL) calculated from the LV chamber diameter (LVD). When adapted to the forensic autopsies of this series the formula is MyL = 0.88 × LVD + 33.6 mm. That formula is avoided here and, for simplicity, is replaced in this report whenever possible by the directly measured covariate, LVD, so that LVD can be recognized as denoting mean myocyte length using transformed units of measure.
This report documents findings in formalin-fixed, H&E-stained paraffin sections from postmortem specimens. For histological evaluation of myocyte cross sections (Figure 1) an appropriate elliptic outline is imposed upon each profile. The least diameter of this ellipse is emphasized because the largest diameter is often inaccessible to sufficiently reliable measurement. Each ellipse is recalculated into an idealized circle, calling its diameter myocyte breadth, MyB. Calculations are then made for area (MyA = π × (0.5 × MyB)2) and volume (MyV = MyA × MyL). Myocyte number (MyN) follows from LV mass (LVM) as MyN ≈ 0.75 × LVM/MyV where 0.75 is a commonly reported estimate of myocyte volume fraction in the tissue section.
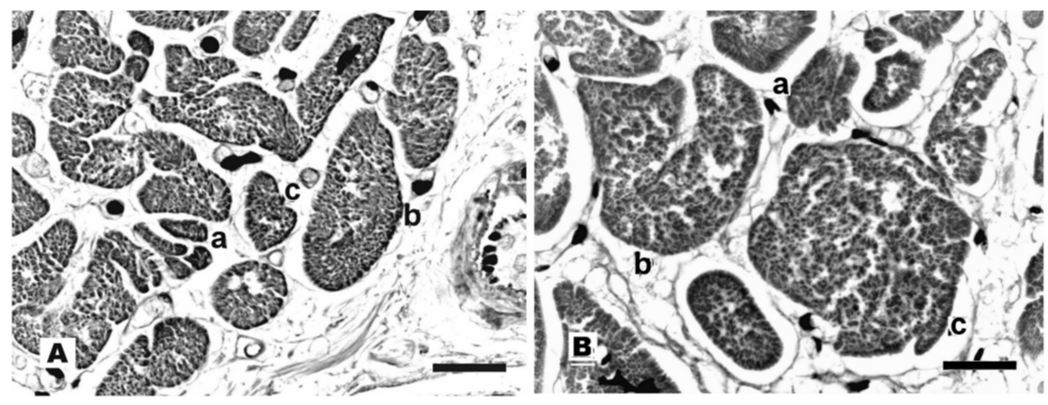
Figure 1: A = Normal; B = Hypertrophy. H&E paraffin sections. a, b, c are smallest, average, and largest MyB. Bars = 40 μm.
No practical method is available for consistently measuring myocyte length, MyL, for individual myocytes in these tissue sections. This constraint directs attention to mean MyL in each specimen, which suffices for present purposes. Some simplifying assumptions help when determining mean myocyte length in a specimen. In these tissue preparations the LV is visualized as exhibiting a state of potentiated systole, because all sarcomeres are fully shortened to the anatomic limit of about 1.65 μm length. In the equatorial LV plane used here the orientation of midwall myofibrils is such that it accommodates summing of sarcomeres along the LV circumference. In a chamber of 36 mm diameter, for instance, the midwall circumference is taken to be 3.14159 × (36 + 2 × 5) = 144 mm, where the half wall thickness usually averages near 5 mm. Hence the midwall circumference is found to be about 144 / 0.00165 = 87,600 sarcomeres. Using the Tamura formula introduced above would yield the rough estimate of MyL = 160 μm, but that error-prone transformation is omitted here and LVD itself serves as a practical approximation for MyL hereafter, i.e. 144 μm in this example.
Myocyte length, MyL, is used to express longitudinal hypertrophy, i.e. sarcomeres added to the myocyte in the longitudinal dimension, which extends along the LV midwall circumference. Myocyte breadth, MyB, reflects transverse hypertrophy (sarcomeres added in the transverse dimension, i.e. both LV axial and radial directions).
Figure 2 plots the two forms of myocyte hypertrophy against each other. MyB has a tendency to increase in company with LVD, and the magnitude of this association across the LVD grouping intervals is given in the R2 = 0.203, which is the residual variation on the vertical axis summed across LVD grouping intervals in Table 1.
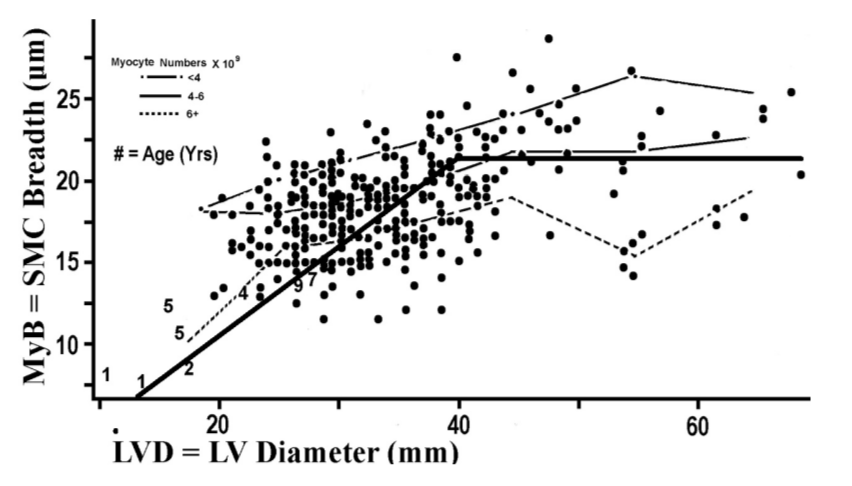
Figure 2: Indices for myocyte hypertrophy of the 2 types, transverse (MyB) and longitudinal (LVD for calculating MyL) are plotted for 276 forensic autopsies plus 8 children denoted by age. The three plotted lines labeled with myocyte numbers per specimen are introduced for later discussion. Angulated bold line is introduced to aid discussion.
| Table 1: Means of MyB according to LV Diameter | |||
| LV Diameter (mm) | MyB* | Cases | |
| Range | Mean | (μm) | (N) |
| 11-20 | 19.7 | 16.4AB | 5 |
| 21-30 | 26.9 | 17.5A | 103 |
| 31-40 | 35.7 | 18.5B | 111 |
| 41-50 | 44.6 | 21.6C | 37 |
| 51-60 | 54.6 | 19.3B | 12 |
| 61+ | 64.5 | 20.9BC | 8 |
| *MyB is myocyte breadth. Means that fail to share a symbol A, B or C differ significantly at p < .05 by t-test. | |||
The cases represented by dots in Figure 2 were not chosen by random sampling but instead were carefully selected for certain manifest features. This biased sampling scheme puts limits onto the use of these data for statistical inference. At autopsy all instances of LV hypertrophy (heart weight > 450 gm in men and 400 grams in women) were retained, after omitting those that showed valvular deformities, loss of muscle to infarction, or uncommon other conditions. (These exclusions, after retaining overweight subjects, leave only hypertension as additional cause for transverse myocyte hypertrophy, a topic for later consideration.) The “normal” specimens, i.e. those with small LVD, are to be compared with hypertrophied ones; these normal subjects are purposefully over represented in the left upper quadrant of Figure 2. The experimental design is retrospective, as appropriate solely for the purpose of hypothesis generation; hypothesis testing is not permitted with this design.
The size of LVD, which determines longitudinal hypertrophy expressed by MyL, is physiologically designed in large part so as to serve the body’s need for cardiac output. Oversized bodies, as measured by body weight (BW), call for enhanced stroke volume (SV) because pulse rate is generally independent of body size. The increase of SV in heavier bodies is delivered in response to augmented systolic excursion of the LVD as appropriate to each attained chamber size. This excursion must overcome the tensile stress of the LV equatorial midwall as that stress rises in proportion to chamber radius in keeping with the simplified Laplace equation. Stress = k × Radius / Wall Thickness. The product of these two factors, excursion × stress, is called stroke work (SW).
In a state of resting good health and without overweight the observed SW is a small fraction of its maximal capability [5], which indicates the existence of a large reserve for contractile force to overcome challenges imposed by expanding LVD.
Body weight is not the only cause for LVD-linked myocyte hypertrophy, and this complexity can present some challenges to mathematical intuition. Chief among these additional causes are numerous assorted forms of cardiomyopathy; cases with these conditions, along with a few other poorly defined cases, appear in Figure 3 as a cluster of points in the left upper quadrant of the scatter plot. These outliers, when viewed in Figure 2, cluster with the overweight cases in the right hand extreme of the graph. Graphic inspection in Figure 2 can suggest a simple model to use for exploring the data (angulated solid line): Draw a line radiating from the graphic origin up to point (22.2,40), then turn the line so that it falls upon the zero slope regression line, MyB = 22.2 μm. This model invites further exploration.
The effect of overweight upon chamber dilatation expresses the way that a physiological force (weight) acts upon a geometric magnitude (LVD). Figure 3 depicts this relationship. Table 2 provides an overview of the 1-way ANOVA for this scatter plot. In Table 2 a linear regression line relating LVD to BW can be fit to the nine pairs of means in those two columns and this has R2 = 0.920. This R2 is nearly equal to unity, R2 ≈ 1, which implies that we have explained essentially all of the effect by weight upon LVD so that weight does not have substantial actions beyond this simple linear pattern. It helps to remember that the effect upon cardiomegaly by lean mass, reflected in height, is indistinguishable from fat mass estimated from body mass index, BMI, within this body of data, and weight sums fat plus nonfat body mass.
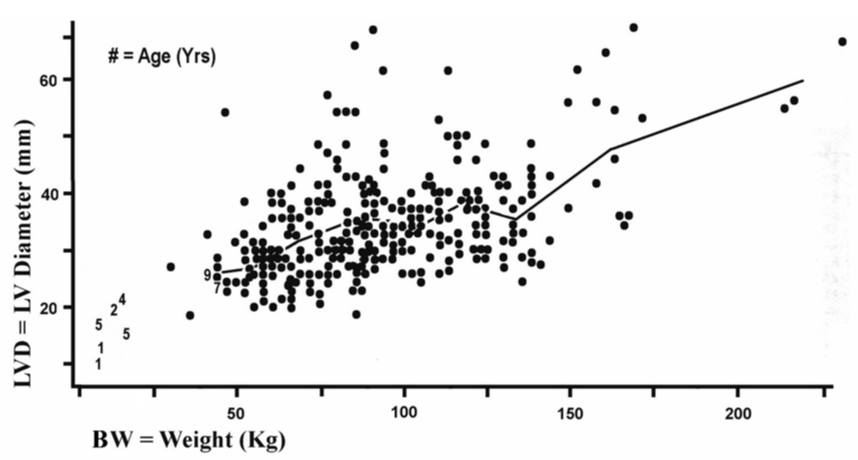
Figure 3: Index of longitudinal myocyte hypertrophy (LVD) is plotted by total body weight (BW). The line joining means of LVD within grouping intervals of BW (children noted by numerals are excluded) does not differ significantly from a sloping straight line. (r = .2539 among points and r = .2182 among means, ns p>.05.).
The impact of body weight (BW) upon LV chamber size emerged here as described nearly in full by a simple linear pattern, which leaves the effect of BW upon longitudinal hypertrophy fully explained for practical consideration. How does BW affect transverse myocyte hypertrophy (MyB) is a logical next question. Figure 4 introduces this topic. Table 3, to be revisited later, forms the background for the one-way ANOVA appropriate to this topic (not shown). This ANOVA uses nine pairs of means, one for MyB (pooling with and without hypertension groups) and one for BW. The linear regression line fit to these pairs of means has R2 = 0.813, which is substantially less than the 0.920 noted above. Clearly the topic calls for greater complexity than just the linear pattern in Table 2.
| Table 2: Means of LVD according to body weight* | ||||
| BW = Body Weight (Kg) | LVD | LVV | Cases | |
| Range | Mean | (mm) | (cm3) | (N) |
| <53.2 | 46.9 | 28.8A | 23.9 | 15 |
| 53.2- 64.6 | 59.5 | 28.9A | 24.1 | 33 |
| 64.7- 76.8 | 70.6 | 32.0A | 32.8 | 39 |
| 76.9- 86.4 | 81.7 | 34.4B | 40.7 | 30 |
| 86.5- 96.8 | 90.7 | 36.8B | 49.8 | 41 |
| 96.9- 110.9 | 104.2 | 34.4B | 40.7 | 36 |
| 111.0-122.7 | 116.3 | 37.8B | 54.0 | 29 |
| 122.8-139.7 | 131.0 | 35.1B | 43.2 | 31 |
| >139.7 | 164.1 | 47.8C | 109.2 | 22 |
| *LVD is LV Diameter. LVV is chamber volume estimated from the LV spherical model. Tabulated means that fail to share a symbol A, B or C differ significantly at p < .05 by t-test. | ||||
| Table 3: Means of myocyte breadth(MyB) according to body weight by type 2 hypertension | ||||
| BW = Body Weight (Kg) | MyB (μm) | N Cases | ||
| Range | Mean | Type 2 Hypertension | No/Yes | |
| No | Yes | |||
| <53.2 | 46.9 | 15.5A | 17.8A | 9/6 |
| 53.2-64.6 | 59.5 | 16.3A | 17.7A | 25/8 |
| 64.7-76.8 | 70.6 | 17.1A | 19.1B | 21/18 |
| 76.9-86.4 | 81.7 | 18.1A | 21.7B | 20/10 |
| 86.5-96.8 | 90.7 | 18.9A | 18.6A | 27/14 |
| 96.9-110.9 | 104.2 | 18.5A | 19.9A | 25/11 |
| 111.0-122.7 | 116.3 | 19.5A | 20.1A | 17/12 |
| 122.8-139.7 | 131 | 19.5A | 19.9A | 22/9 |
| >139.7 | 164.1 | 18.7A | 23.4B | 16/6 |
| ANOVA | F | P | ||
| Weight | 5.08 | <.001 | ||
| Hypertension | 17.77 | <.001 | ||
| Interactions | 1.77 | 0.083 | ||
| Tabulated means within a column that fail to share a symbol A or B differ significantly at p < .05 by t-test. | ||||
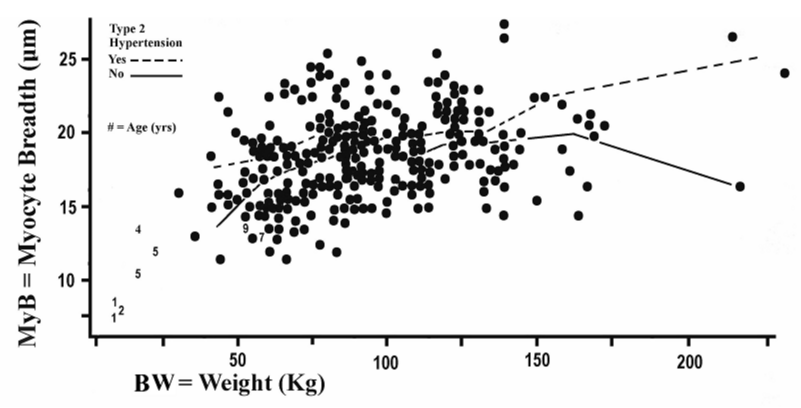
Figure 4: Dots plot an index for cardiomyocyte transverse hypertrophy (MyB) against total body weight in 276 forensic autopsies (8 children denoted by age can be used for visual inspection but are omitted from statistical analyses). The two plotted lines concerning type 2 hypertension are introduced for later discussion.
Table 4 shows the trends taken by assorted variables as the chamber diameter expands. The data on stroke volume offer an overview of how overweight might bear upon these trends. At the systolic chamber diameters of LVD = 26-35 mm, a size grouping one step above the smallest group; the stroke volume needed to serve the needs of these subjects averages 72 ml in this data set. In these small chambers the endocardial circumference has fractional shortening by 33.7 % during systole (data not shown). In the largest chambers having measured SV, LVD = 66-75 mm and stroke volume = 123 ml, the endocardial fractional shortening is only 16.4 % (data not shown). The stroke volume rising 123 / 72 = 1.71 fold is driven by midwall sarcomere shortening that is reduced to just 12.6 % (Table 4). Increased numbers of sarcomeres are required to deliver the enhanced SV of longitudinal hypertrophy, hence each sarcomere performs less and less contraction as its contribution to the increasing total excursion is diluted by more added sarcomeres. The sarcomere length at end systole is approaching the diastolic length, which puts a limit nearing zero upon the total shortening. These events require no mention of contractile weakening which can be envisioned as absent.
| Table 4: Midwall features in the LV equatorial plane according to LV diameter(LVD) | |||||||
| Sarcomere | Systolic | ||||||
| Midwall | Midwall | Systolic | Midwall | Stroke | |||
| LVD | Circumference (mm) | Excursion | Shortening | Length | Stress | Volume | |
| (mm) | Diastolic | Systolic | (mm) | (%) | (μm) | (N×102/m2) | (ml) |
| 16-25 | 110 | 92.3 | 17.7 | 16.1 | 1.85 | 140 | 36 |
| 26-35 | 154.3 | 124.1 | 30.2 | 19.6 | 1.77 | 183 | 72 |
| 36-45 | 175 | 143.7 | 31.3 | 17.9 | 1.8 | 248 | 82 |
| 46-55 | 199.5 | 170.4 | 29.1 | 14.5 | 1.88 | 345 | 87 |
| 56-65 | 226.5 | 194.8 | 31.7 | 14 | 1.89 | 352 | 108 |
| 66-75 | 258.9 | 226.4 | 32.5 | 12.6 | 1.92 | 496 | 123 |
| 71-79 | 261.1 | 245.2 | 15.9 | 6.1 | 2.06 | ||
| 76-79 | 267 | 253.1 | 13.9 | 5.2 | 2.08 | ||
Table 4 also documents the rise of tensile stress in the expanding midwall circumference as a response to the increasing radius in the Laplace formula, Stress = k × Radius / Wall Thickness. The full range of this rise in stress from the smallest to the largest chambers is 496/140 = 3.54 fold. Throughout this range in stress the sarcomeres have sufficient reserves in energy to deliver the extra needed strength up to the limits imposed upon the largest chambers [5]. Only at this extreme does the need arise to invoke contractile weakening as the sarcomeres come to exceed their reserves.
A simplistic model can be constructed to summarize the ways that overweight might lead to modification of myocyte behavior. First, the delivery of enhanced stroke volume required by the large body is accomplished by enlarging the LV chamber. This enlargement introduces a serious imbalance between myocyte dimensions (which obey linear rules) and chamber volume (which obeys cubic rules). This imbalance can generate deceptive cardiographic appearances that falsely suggest contractile weakening of the sarcomeres. Second, the increased chamber circumference is accomplished by adding sarcomeres in series so as to elongate each of the myocytes (longitudinal hypertrophy) without changing their numbers. Third, the increasing chamber radius in the Laplace formula for wall stress, which at first causes transverse myocyte hypertrophy, later evokes progressively less incremental hypertrophy of MyB that settles finally into a steady state in the largest chambers (Figure 2).
Lean and fat body mass are nearly equal when generating overweight kg per kg, and therefore also nearly equal when acting upon myocyte longitudinal hypertrophy. These empirical rules imply that stroke work can be assessed by simple summation of fat plus nonfat mass for use in practical inquiries.
Obesity is well known to produce increased risk of adverse cardiovascular events. These risks are not entirely due to stroke work overload, but can emerge in part from degradation in arteries including the coronaries. Current evidence favors the view that body fat may dominate the enhancement of atherosclerosis because lean body mass has little if any demonstrable effect on cardiovascular crises under most circumstances. The increase in skeletal muscle that accompanies obesity also appears to be outside of the chain of causation that leads to catastrophic events. A starkly different effect by lean mass, however, is seen with cardiomyocyte longitudinal hypertrophy where lean and fat body mass act alike. In this setting the effects of total body mass can be explained in full, or nearly in full, by the scaling upward of LV stroke work, which is measured by stroke volume when pulse rate is unchanged. Hence it could be this stroke work that mediates practically all of the myocyte hypertrophy. It seems reasonable to propose that heart failure might result in part from the load on stroke work that is imposed by muscle plus skeletal mass.
The data set under consideration here provides some limited information about hypertension. The blood pressure level obtained by a cuff on the arm is a composite of two inputs [14]: Type 2 – a renal microischemic component imposed by age-related sclerosis scattered through the interlobular arteries imposing actions upon renin-salt interactions. Type 1– a neurohumoral component that incorporates all other mechanisms that are independent of renal microischemia. In this data set the renal microischemic component was a measured variable and the residual neurohumoral effects were included in the error term of the ANOVA. The microischemic component is the one that accumulates with age and which therefore accounts for nearly all of the blood pressure rise with age, i.e. the major factor that affects the risk of cardiovascular events under usually prevailing circumstances.
The dotted and solid lines in Figure 4 plot the means of MyB within intervals of total body weight for subjects with and without type 2 hypertension respectively. The ANOVA of this figure given in Table 3 indicates an absence of interactions between weight and hypertension which suggests that the hypertension effect is alike at all body weights within this particular data set. (A consistent finding throughout these studies has been that type 2 blood pressure does not correlate with body weight or with body mass index, indicating that only type 1 blood pressure conveys those well-known correlations.). The conclusion reached here is that the type 2 hypertension does not mediate the effect of body weight on cardiomyocyte hypertrophy, either the longitudinal or the transverse kind, but type 1 is implicated.
Another variable available in this data set is left ventricular mass (LVM). Having longitudinal and transverse dimensions of average myocytes to estimate cell volume (MyV) myocyte numbers can be calculated, MyN = LVM/MyV. In Figure 2 the means of MyB are plotted within intervals of LVD for tertiles of MyN. In each of the MyN tertiles the plots reveal a gradual flattening of the slopes with increasing LVD, therefore reiterating the pattern for the pool of all cases seen in the broad angulated line. The strength of MyB partial correlation with LVD is indicated by R2 = 0.203 and partial correlation with MyN is R2 = 0.356 while the total multivariate R2 = 0.521 which does not differ significantly from the sum, 0.559. These findings indicate that MyB and MyN do not interact when promoting longitudinal myocyte hypertrophy.
An eye catching feature of the scatter plots in Figure 2 is the large range of residual departures on the vertical axis. Figure 4 can be of special interest to cardiologists seeking to manage cardiac hypertrophy. As a determinant of cardiac hypertrophy and subsequent heart failure the body weight is of modest total impact; its contribution is roughly estimated by R2 = 0.203. When assessing the management of an obese hypertensive patient the excessive weight should not discourage a further search for other potentially more important considerations.
In conclusion, body weight exerts important influences upon cardiomyocyte longitudinal and transverse hypertrophy. A likely mechanism for these effects is the expansion of LV chamber volume that serves to deliver the needs for ever rising cardiac output. This expansion drives the systolic work load on the LV wall because of increased radius in the Laplace formula for wall stress and because of enhanced systolic excursion of elongated myocytes. The quantitative details of these relationships appear to be fully consistent with the viewpoint that body weight has no other mechanism for propelling LV hypertrophy beyond just these elementary mechanical principles. Contractile weakening appears to be a late consequence of the changing geometry.
- Tracy RE, Sander GE. Histologically measured cardiomyocyte hypertrophy correlates with body height as strongly as with body mass index. Cardiol Res Pract. 2011; 2011: 658958. PubMed: https://www.ncbi.nlm.nih.gov/pubmed/21738859
- Tracy RE. Cardiomyocyte size estimated from noninvasive measurements of left ventricular wall thickness and chamber diameter. J Amer Soc Hypertens. 2012; 6: 185-192. PubMed: https://www.ncbi.nlm.nih.gov/pubmed/22417735
- Tracy RE. Eccentric may differ from concentric left ventricular hypertrophy because of variations in cardiomyocyte numbers. J Card Failure. 2013; 19: 517-522. PubMed: https://www.ncbi.nlm.nih.gov/pubmed/23834928
- Tracy RE. Cardiac myocyte sizes in right compared with left ventricle during overweight and hypertension. J Amer Soc Hypertens. 2014; 8: 457-463. PubMed: https://www.ncbi.nlm.nih.gov/pubmed/25064767
- Tracy RE. Heart failure and limit to cardiomyocyte hypertrophy: Lessons from autopsies. Eur J Forensic Sci. 2016.
- Tracy RE. Limit to cardiomyocyte hypertrophy in right and left ventricles: Possible precursors of systolic heart failure. J Forensic Research. 2016; 7: 1000345.
- Karsner HT, Saphir O, Todd TW. The State of the cardiac muscle in hypertrophy and atrophy. Am J Pathol. 1925; 1: 351-372. PubMed: https://www.ncbi.nlm.nih.gov/pubmed/19969656
- Linzbach AJ. Heart failure from the point of view of quantitative anatomy. Am J Cardiol. 1960; 5: 370-382. PubMed: https://www.ncbi.nlm.nih.gov/pubmed/14417346
- Gerdes AM. Cardiac myocyte remodeling in hypertrophy and progression to failure. J Card Fail. 2002; 8: S264-S268. PubMed: https://www.ncbi.nlm.nih.gov/pubmed/12555130
- Devereux RB. Echocardiographic insights into the pathophysiology and prognostic significance of hypertensive cardiac hypertrophy. AmJ Hypertens. 1989; 2: 186S-195S. PubMed: https://www.ncbi.nlm.nih.gov/pubmed/2526645
- De Simone G, Devereux RB, Roman MJ, Ganau A, Saba PS, et al. Assessment of left ventricular function by the mid wall fractional shortening/end-systolic stress relation in human hypertension. J Am Coll Cardiol. 1994; 23: 1444-1451.
- Streeter DD, Spotnitz HM, Pate DP, Ross J Jr, Sonnenblick EH. Fiber Orientation in the Canine Left Ventricle during Diastole and Systole. Circ Res. 1969; 24: 339-347. PubMed: https://www.ncbi.nlm.nih.gov/pubmed/5766515
- Tamura T, Onodera T, Said S, Gerdes AM. Correlation of myocyte lengthening to chamber dilation in the spontaneously hypertensive heart failure (SHHF) rat. J Mol Cell Cardiol. 1998; 30: 2175-2181. PubMed: https://www.ncbi.nlm.nih.gov/pubmed/9925355
- Tracy RE. Renal vasculature in essential hypertension: a review of some contrarian evidence. Contrib Nephrol. 2011; 169: 327-336. PubMed: https://www.ncbi.nlm.nih.gov/pubmed/21252530